About one month ago, Chipper Jones, Vladimir Guerrero, Jim Thome, and Trevor Hoffman were elected to the Baseball Hall of Fame, which means two things: (1) this Hall of Fame election post mortem is almost one month overdue, and (2) for the first time in three years, my forecasting model correctly predicted the entire Hall of Fame class.
You'd think that would be cause for satisfaction (and I suppose it is better than nothing), but instead I'm pretty disappointed with its performance. The reason is that an election model doesn't really try to peg winners per se; rather, it tries to predict final vote totals—in other words, numbers. And quantitatively, my model had an off year, especially compared to some of my peers in the Hall of Fame forecasting world.
First, a brief rundown of my methodology. My Hall of Fame projections are based on the public ballots dutifully collected and shared with the world by Ryan Thibodaux (and, this year, his team of interns); I extend my gratitude to them again for sacrificing so much of their time doing so. Based on the percentage of public ballots each player is on to date, I calculate his estimated percentage of private (i.e., as yet unshared) votes based on how much those two numbers have differed in past Hall of Fame elections. These "Adjustment Factors"—positive for old-school candidates like Omar Vizquel, negative for steroid users or sabermetric darlings like Roger Clemens—are the demographic weighting to Ryan's raw polling data. And indeed, they produce more accurate results than just taking the Thibodaux Tracker as gospel:
My model's average error was 1.6 percentage points; the raw data was off by an average of three points per player. I didn't have as many big misses this year as last year; my worst performance was on Larry Walker, whom I overestimated by 5.0 points. My model assumed the erstwhile Rockie would gain votes in private balloting, as he had done every year from 2011 to 2016, but 2017 turned out to be the beginning of a trend; Walker did 10.5 points worse on 2018 private ballots than on public ones. I also missed Thome's final vote total by 3.5 points, although I feel better about that one, since first-year candidates are always tricky to predict. Most of my other predictions were pretty close to the mark, including eight players I predicted within a single percentage point. I came within two points of the correct answer for 17 of the 23 players forecasted, giving me a solid median error of 1.3 points. For stat nerds, I also had a root mean square error (RMSE) of 1.9 points.
All three error values (mean, median, and RMS) were the second-best of my now-six-year Hall of Fame forecasting career. But that's misleading: during the past two years, thanks to Ryan's tireless efforts, more votes have been made public in advance of the announcement than ever before. Of course my predictions are better now—there's less I don't know.
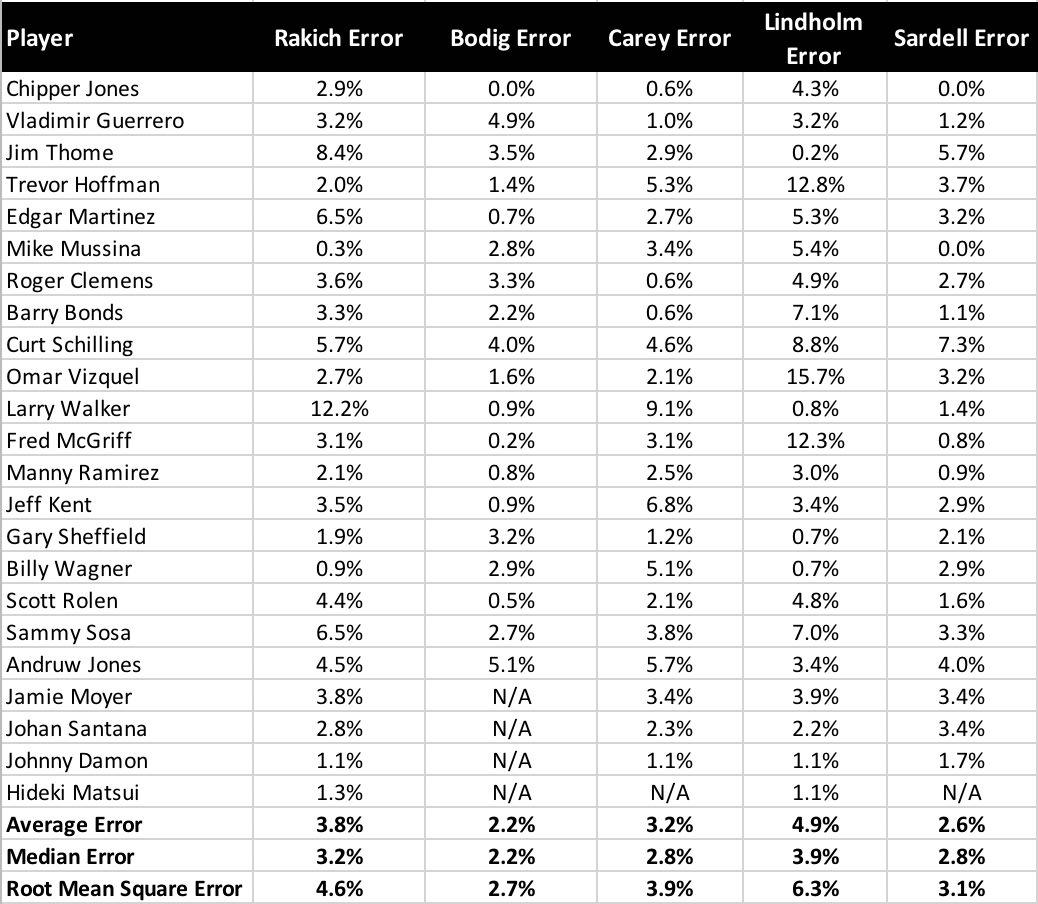
Really what we should be measuring is my accuracy at predicting only the 175 ballots that were still private when I issued my final projections just minutes before Jeff Idelson opened the envelope to announce the election winners. Here are the differences between my estimates for those ballots and what they actually ended up saying.
The biggest misses are still with the same players, but the true degree of my error is now made plain. I overshot Walker's private ballots by more than 12 percentage points, and Thome's by more than eight. Those aren't good performances no matter how you slice them. If we're focusing on the positives, I was within four percentage points on 16 of 23 players. My average error was 3.8 points, much better than last year when I had several double-digit misses, but my median error was 3.2 points, not as good as last year.
But where I really fell short was in comparison to other Hall of Fame forecasters: Chris Bodig, who published his first-ever projections this year on his website, Cooperstown Cred; Ross Carey, who hosts the Replacement Level Podcast and is the only one with mostly qualitative predictions; Scott Lindholm, who has been issuing his projections alongside me since day one; and Jason Sardell, who first issued his probabilistic forecast last year. Of them all, it was the rookie who performed the best: Bodig's private-ballot projections had a mean and median error of only 2.2 percentage points. His RMSE also ranked first (2.7 points), followed by Sardell (3.1), Carey (3.9), me (4.6), and Lindholm (6.3). Bodig also came the closest on the most players (10).
Overall, my model performed slightly better this year than it did last year, but that's cold comfort: everyone else improved over last year as well (anecdotally, this year's election felt more predictable than last), so I repeated my standing toward the bottom of the pack. Put simply, that's not good enough. After two years of subpar performances, any good scientist would reevaluate his or her methods, so that's what I'm going to do. Next winter, I'll explore some possible changes to the model in order to make it more accurate. Hopefully, it just needs a small tweak, like calculating Adjustment Factors based on the last two elections rather than the last three (or weighting more recent elections more heavily, a suggestion I've received on Twitter). However, I'm willing to entertain bigger changes too, such as calculating more candidates' vote totals the way I do for first-time candidates, or going more granular to look at exactly which voters are still private and extrapolating from their past votes. Anything in the service of more accuracy!

