Then Edgar Martínez started polling at 80%. And stayed there. And stayed there. And stayed there.
Thanks to Edgar's steady strength in Ryan Thibodaux's BBHOF Tracker, which aggregates all Hall of Fame ballots made public so far this year, my projection model of the Baseball Hall of Fame election has alternated between forecasting the Mariner great's narrow election and predicting he would barely fall short. Despite the roller coaster of emotion these fluctuations have caused on Twitter, the reality is that my model paints a consistent picture: Martínez's odds are basically 50-50.
My model, which is in its sixth year of predicting the Hall of Fame election, operates on the premise that publicly released ballots differ materially—and consistently—from ballots whose casters choose to keep them private. BBWAA members who share their ballots on Twitter tend to be more willing to vote for PED users, assess candidates using advanced metrics, and use up all 10 spots on their ballot. Private voters—often more grizzled writers who in many cases have stopped covering baseball altogether—prefer "gritty" candidates whose cases rely on traditional metrics like hits, wins, or Gold Glove Awards. As a result, candidates like Barry Bonds, Roger Clemens (PEDs), Mike Mussina (requires advanced stats to appreciate), and Martínez (spent most of his career at DH, a position many baseball purists still pooh-pooh) do substantially worse on private ballots than on public ballots. Candidates like Hoffman (so many saves) and Omar Vizquel (so many Gold Gloves) can be expected to do better on ballots we haven't seen than on the ones we have.
That means the numbers in Thibodaux's Tracker—a.k.a. the public ballots—should be taken seriously but not literally. What my model does is quantify the amount by which each player's vote total in the Tracker should be adjusted. Specifically, I look at the percentage-point difference between each player's performance on public vs. private ballots in the last three Hall of Fame elections (2017, 2016, and 2015). The average of these three numbers (or just two if the player has been on the ballot only since 2016, or just one if he debuted on the ballot last year) is what I call the player's Adjustment Factor. My model simply assumes that the player's public-to-private shift this year will match that average.
Let's take Edgar as an example. In 2017, his private-ballot performance was 16.6 percentage points lower than his public-ballot performance. In 2016, it was 7.7 percentage points lower, and in 2015 it was 6.8 percentage points lower. That averages out to an Adjustment Factor of −10.37 percentage points. As of Monday night, Martínez was polling at 79.23% in the Tracker, so his estimated performance on private ballots is 68.86%.
The final step in my model is to combine the public-ballot performance with the estimated private-ballot performance in the appropriate proportions. In the same example, as of Monday night, 207 of an expected 424 ballots had been made public, or 48.82%. If 48.82% of ballots vote for Martínez at a rate of 79.23%, and the remaining 51.18% vote for Martínez at a rate of 68.86%, that computes to an overall performance of 73.92%—just over one point shy of induction.
But my model is far from infallible. Last year, my private-ballot projections were off by an average of 4.8 percentage points—a decidedly meh performance in the small community of Hall of Fame projection models. (But don't stop reading—historically, my projections have fared much better.) Small, subjective methodological decisions can be enough to affect outcomes in what is truly a mathematical game of inches. For example, why take a straight average of Edgar's last three public-private differentials when they have been growing more and more gaping over time? (Answer: in past years, with other candidates, a straight average has proven more accurate than one that weights recent years more heavily. Historically speaking, Edgar is equally likely to revert to his "usual" modest Adjustment Factor as he is to continue trending in a bad direction.) If there's one thing that studying Hall of Fame elections has taught me, it's that voters will zig when you expect them to zag.
One of my fellow Hall of Fame forecasters, Jason Sardell, wisely communicates the uncertainty inherent in our vocation by providing not only projected vote totals, but also the probability that each candidate will be elected. His model, which uses a totally different methodology based on voter adds and drops, gives Edgar just a 12% chance of induction as of Monday night. I'm not smart enough to assign probabilities to my own model, but as discussed above, it's pretty clear from the way Edgar has seesawed around the required 75% that his shot is no better than a coin flip. Therefore, when the election results are announced this Wednesday at 6pm ET, no matter where Martínez will fall on my model, no outcome should be a surprise.
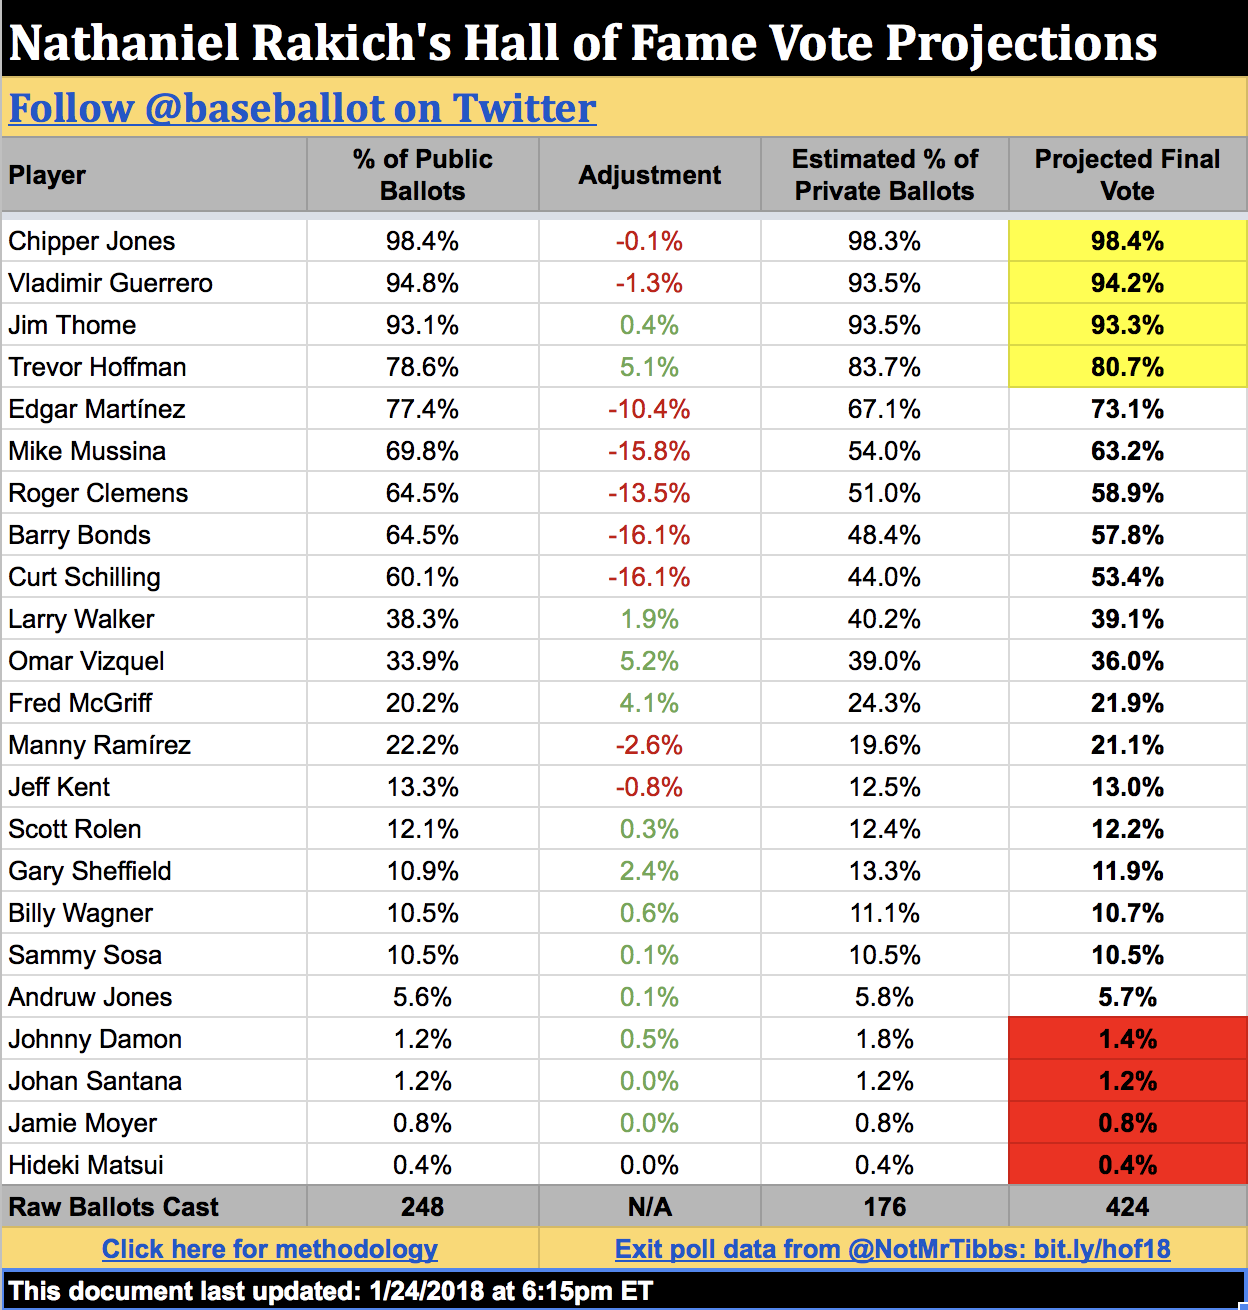
Below are my current Hall of Fame projections for every candidate on the ballot. They will be updated in real time leading up to the announcement. (UPDATE, January 24: The below are my final projections issued just before the announcement.)
(Still with me? Huzzah. There's one loose methodological end I'd like to tie up for those of you who are interested: how I calculate the vote shares of first-time candidates. This year, that's Chipper Jones, Thome, Vizquel, Scott Rolen, Andruw Jones, Johnny Damon, and Johan Santana.
Without previous vote history to go off, my model does the next best thing for these players: it looks at which other candidate on the ballot correlates most strongly with—or against—them. If New Candidate X shares many of the same public voters with Old Candidate Y, then we can be fairly sure that the two will also drop or rise in tandem among private ballots. For example, Vizquel's support correlates most strongly with opposition to Bonds: as of Monday night, just 21% of known Bonds voters had voted for Vizquel, but 49% of non-Bonds voters had. Holding those numbers steady, I use my model's final prediction of the number of Bonds voters to figure out Vizquel's final percentage as well.
Here are the other ballot rookies' closest matches:
- Chipper voters correlate best with Bonds voters, though not super strongly, with the result that Chipper is expected to lose a little bit of ground on private ballots.
- Thome voters have a strong negative correlation with Manny Ramírez voters, so Thome is expected to gain ground in private balloting.
- Rolen voters correlate well with Larry Walker voters, giving Rolen a slight boost among private voters.
- Andruw voters are negatively correlated with Jeff Kent voters; in fact, no one has voted for both men. This gives Andruw a tiny bump in private balloting.
- It's a very small sample, but public Damon voters and public Bonds voters have zero overlap. Damon gets a decent-sized private-ballot bonus because of that.
- Santana voters are also inclined to vote for Gary Sheffield at high rates, although small-sample caveats apply. Therefore, Santana gets a slight boost in the private projections.
Finally, anyone with one or zero public votes is judged to be a non-serious candidate. Every year, one or two writers casts a misguided ballot for a Tim Wakefield or a Garret Anderson. There's little use in trying to predict these truly random events, so all of these players—including Jamie Moyer this year—have an Adjustment Factor of zero.)