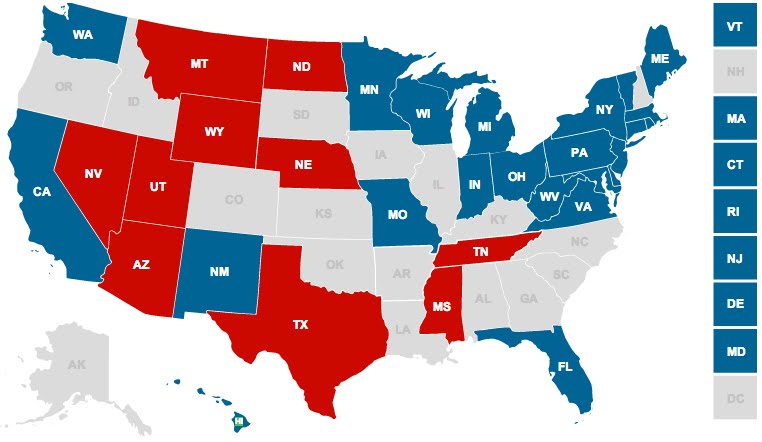
Imagine my surprise this week when I hear that I've already missed a few State of the State addresses. Like the president's State of the Union, States of the State are important policy messages from most states' governors to a joint session of their legislatures—so I wanted to pay close attention to them this year. (It is true, after all, that most policy that affects people is made in state capitals—especially with the US Congress in the state it's in.) Ergo, although it's a little late for some of the addresses, I compiled the list below of all 2013 State of the State addresses, and I figured I'd make it public.
This list will be updated throughout the month as new dates are announced; also, once an address has been given, I'll link to the text of the remarks.
Alabama: February 5 at 6:30pm CT
Alaska: January 16 at 7pm AKT
Arizona: January 14 at 1:45pm MT
Arkansas: January 15 at 10:30am CT
California: January 24 at 9am PT
Colorado: January 10 at 11am MT
Connecticut: January 9 at noon ET
Delaware: January 17 at 7:30pm ET
Florida: March 5 at 11am ET
Georgia: January 17 at 11am ET
Hawaii: January 22 at 10am HAT
Idaho: January 7 at 1pm MT
Illinois: February 6 at noon CT
Indiana: January 22 at 7pm ET
Iowa: January 15 at 10am CT
Kansas: January 15 at 6:30pm CT
Kentucky: February 6 at 7pm ET
Louisiana: April 8 at 1pm CT
Maine: February 5 at 7pm ET
Maryland: January 30 at noon ET
Massachusetts: January 16 at 7:30pm ET
Michigan: January 16 at 7pm ET
Minnesota: February 6 at 7pm CT
Mississippi: January 22 at 5pm CT
Missouri: January 28 at 7pm CT
Montana: January 30 at 7pm MT
Nebraska: January 15 at 10am CT
Nevada: January 16 at 6pm PT
New Hampshire: February 14 at 10am ET
New Jersey: January 8 at 2pm ET
New Mexico: January 15 at 1pm MT
New York: January 9 at 1:30pm ET
North Carolina: February 18 at 7pm
North Dakota: January 8 at 1:30pm CT
Ohio: February 19 at 6:30pm ET
Oklahoma: February 4 at noon CT
Oregon: January 14 at 11am PT
Pennsylvania: February 5 at 11:30am ET
Rhode Island: January 16 at 7pm ET
South Carolina: January 16 at 7pm ET
South Dakota: January 8 at 1pm CT
Tennessee: January 28 at 6pm CT
Texas: January 29 at 11am CT
Utah: January 30 at 6:30pm MT
Vermont: January 10 at 2pm ET
Virginia: January 9 at 7pm ET
Washington: January 15 at 11:30am PT
West Virginia: February 13 at 7pm ET
Wisconsin: January 15 at 7pm CT
Wyoming: January 9 at 10am MT
National: February 12 at 9pm ET
Thursday, January 10, 2013


Tuesday, January 8, 2013
Will Craig Biggio Make the Hall of Fame After All?
When I last assessed the Hall of Fame vote four days ago, I concluded the piece by applying the average error of past Hall of Fame "exit polls" to the current exit polls to arrive at an estimate for their final vote totals tomorrow. This method yielded some good insights, such as the fact that Jack Morris and Lee Smith will almost certainly overperform their polls, while Tim Raines will almost certainly underperform them. But it also told us precious little about other players—namely, the ones for whom it is their first year on the ballot. This was a particularly frustrating shortcoming because the player who is currently on the cusp of induction according to exit polls—Craig Biggio, with 70% of the vote so far—is also on the ballot for the first time.
I felt that I couldn't apply an adjustment to Biggio's exit polls because we're not sure what type of voter is likely to vote for him. He could overperform his polls, in the event that he gets wide support from the old-school contingent that tends not to publish their ballot early (and thus that is most likely to be underrepresented in the exit polls). He could also underperform, as similar infielders like Barry Larkin and Roberto Alomar have done in the past couple years.
Then I read Nate Silver's column today with his own Hall of Fame vote analysis. In it, Nate looked at @leokitty's compilation of all published Hall of Fame ballots to see which players' support lined up with which other players' support. Nate specifically looked at the behavior of the pro–Barry Bonds bloc in an attempt to decipher the impact that the steroids scandal will have on this year's electorate, but his method can also be used to see who else Biggio voters are more or less likely to vote for.
As mentioned above, my previous research indicated that certain players consistently over- and underperform their exit polls. If we find, using Nate's method of analysis, that Biggio voters also tend to be Raines voters, or Morris voters, or Smith voters, then we can make an educated guess that Biggio will over- or underperform his exit polls by comparable margins.
As of this writing, 50 out of 65 pro-Morris voters were also voting for Biggio—that's 76.9%. The 46 anti-Morris voters gave 28 votes to Biggio: 60.9%. Thus, Biggio appeals more to the pro-Morris crowd than to Morris's detractors, by a 16-point margin.
Of 36 pro-Smith voters, 28 were also voting for Biggio (77.8%); meanwhile, 50 of the 75 non-Smith voters also voted for Biggio (66.7%). So Biggio is also more popular among Lee Smith fans, though the difference is smaller (11.1 points).
And 54 out of 70 pro-Raines voters were also voting for Biggio (77.1%). That leaves 41 anti-Raines voters, 24 of whom included Biggio on their ballot (58.5%). That's the biggest difference yet: 18.6 points.
As should be obvious from the above, if pro-Morris (76.9%), pro-Smith (77.8%), or pro-Raines (77.1%) voters were the only voters, Biggio would be in the Hall of Fame. It is their opponents who are also dragging Biggio down.
Thus, if the exit polls are undersampling Morris and Smith proponents (as they almost certainly are), then Biggio could be in for a boost. On the other hand, if exit polls are undersampling Raines opponents (as they almost certainly are), that could undo a lot of that boost.
In other words, Biggio is not conclusively a favorite of either the old-school crowd or the new sabermetrics- and statistics-oriented crowd. He seems to be a favorite of both—just not enough of a favorite to break that 75% threshold.
I felt that I couldn't apply an adjustment to Biggio's exit polls because we're not sure what type of voter is likely to vote for him. He could overperform his polls, in the event that he gets wide support from the old-school contingent that tends not to publish their ballot early (and thus that is most likely to be underrepresented in the exit polls). He could also underperform, as similar infielders like Barry Larkin and Roberto Alomar have done in the past couple years.
Then I read Nate Silver's column today with his own Hall of Fame vote analysis. In it, Nate looked at @leokitty's compilation of all published Hall of Fame ballots to see which players' support lined up with which other players' support. Nate specifically looked at the behavior of the pro–Barry Bonds bloc in an attempt to decipher the impact that the steroids scandal will have on this year's electorate, but his method can also be used to see who else Biggio voters are more or less likely to vote for.
As mentioned above, my previous research indicated that certain players consistently over- and underperform their exit polls. If we find, using Nate's method of analysis, that Biggio voters also tend to be Raines voters, or Morris voters, or Smith voters, then we can make an educated guess that Biggio will over- or underperform his exit polls by comparable margins.
As of this writing, 50 out of 65 pro-Morris voters were also voting for Biggio—that's 76.9%. The 46 anti-Morris voters gave 28 votes to Biggio: 60.9%. Thus, Biggio appeals more to the pro-Morris crowd than to Morris's detractors, by a 16-point margin.
Of 36 pro-Smith voters, 28 were also voting for Biggio (77.8%); meanwhile, 50 of the 75 non-Smith voters also voted for Biggio (66.7%). So Biggio is also more popular among Lee Smith fans, though the difference is smaller (11.1 points).
And 54 out of 70 pro-Raines voters were also voting for Biggio (77.1%). That leaves 41 anti-Raines voters, 24 of whom included Biggio on their ballot (58.5%). That's the biggest difference yet: 18.6 points.
As should be obvious from the above, if pro-Morris (76.9%), pro-Smith (77.8%), or pro-Raines (77.1%) voters were the only voters, Biggio would be in the Hall of Fame. It is their opponents who are also dragging Biggio down.
Thus, if the exit polls are undersampling Morris and Smith proponents (as they almost certainly are), then Biggio could be in for a boost. On the other hand, if exit polls are undersampling Raines opponents (as they almost certainly are), that could undo a lot of that boost.
In other words, Biggio is not conclusively a favorite of either the old-school crowd or the new sabermetrics- and statistics-oriented crowd. He seems to be a favorite of both—just not enough of a favorite to break that 75% threshold.
Friday, January 4, 2013
How Accurate are Exit Polls—of the Hall of Fame?
Are you a "big-Hall" person or a "small-Hall" person? How about a "zero-Hall" person? It sounds like that might be the consensus on Wednesday, when at 2pm the 2013 Hall of Fame class will be announced. Yes, the conventional wisdom is now that absolutely no one from an absolutely loaded ballot will lasso the 75% of votes necessary for induction.
This is borne out in Baseball Think Factory's extremely cool exit polling of the Hall of Fame vote. How can you do exit polling on a Hall of Fame election, you ask? Simple—you read the myriad ballot columns that are released at this time of year. As of my writing this post, BBTF had canvassed all 93 ballots that have been unveiled by their voters in a column, out of a likely 570 or so that will be cast (although that hardly seems predictive of this year's total, due to the ridiculously controversial ballot—it could stimulate interest and produce a record-high number of ballots, or so many people could be disgusted or bewildered by their choices that the number takes a substantial hit). According to BBTF's poll, no player has 75% of the vote; Craig Biggio, with 69.9%, comes the closest.
But exit polls, as John Kerry so famously learned, can be wrong. Can we determine how wrong they might be? Not for sure, but we can look at the historical performance of the same types of exit polls.
For the past five years, @leokitty has kept a spreadsheet tallying the percentage of votes each player got in the columns released that year. Here is how the figures compared last year, when the sample size was 114 out of an eventual 573 ballots cast (19.9%):

For the class of 2011, she unearthed 122 votes online out of an eventual 581 (21.0%):

And for the class of 2010, only 92 of an eventual 539 ballots (17.1%) were pre-countable:

Obviously any poll comes with a margin of error. However, there are some players whose vote totals are consistently over- or under-predicted by these surveys, just as political polls tend to undersample minorities and the young. Knowing this can tell us a lot about what we might be able to expect on Wednesday.
Specifically, the broad trend appears to be that the exit polls understate support for "old-school" candidates or candidates whose best case for inclusion is superficial. Such candidates include Lee Smith (with his eye-popping quantity of saves), Don Mattingly (the quintessential "professional hitter"), Larry Walker (looked great, but who doesn't at Coors Field?), and Jack Morris (everyone remembers him for that one dominant World Series start).
Another trend is that the exit polls overstate support for SABR-friendly candidates—or, more precisely, they just really overvalue poor Tim Raines. Interestingly, the polls do not seem biased toward or against any of the steroid-tainted characters.
This paints a picture of an polling sample (self-selected, remember; they are the ones who choose to write columns publishing their ballot for all to see) that is more pro-SABR and, if you'll excuse the editorialization, more forward-thinking than the electorate as a whole. This makes sense—a lot of the old-school voters (their minds calcified in an old way of thinking, like that wins and saves are important statistics) are no longer covering baseball, and thus don't have column space to devote to an explanation of their ballot. Similarly, some of the more closed-minded BBWAA members may not be interesting in sharing their ballot with the world, therefore exposing them to be ripped to shreds in comments sections and on Twitter.
So what does this mean for Wednesday's final vote tally, other than that Tim Raines is going to see yet another big dropoff? In the chart below, I've taken each player's current projected vote share as assessed by BBTF and added an adjustment factor, based on the player's average deviation from the exit-poll results in the past three years. For new candidates on the ballot, I've added no such adjustment factor (they are mostly steroid candidates anyway, and that issue has shown to have little effect on the accuracy of exit polls).

So it does indeed look grim. Even with the adjustments, Biggio remains closest. Can he make it? To be honest, looking at these numbers, I doubt it. He doesn't strike me as an old-school candidate; if anything, he's closer to the subtle greatness of Roberto Alomar and Barry Larkin, who were both overvalued by polls before. (But he is also white, which neither Alomar nor Larkin nor Raines is—could this also be a creeping factor?) Meanwhile, the top candidate likely to benefit from the old-school swing, Jack Morris, simply has too much ground to make up. He's currently polling at 62.4%, and while he is almost certain to get more than that on Wednesday, a 12.6-point bump would be unprecedented. If the old-schoolers directed their love to another, closer candidate—Jeff Bagwell—we'd have a decent shot at an induction, but Bagwell has been on the ballot for two years now and has shown no tendency to deviate from the polls. So all that brings us to the real question:
What if they had a Hall of Fame induction but nobody came?
This is borne out in Baseball Think Factory's extremely cool exit polling of the Hall of Fame vote. How can you do exit polling on a Hall of Fame election, you ask? Simple—you read the myriad ballot columns that are released at this time of year. As of my writing this post, BBTF had canvassed all 93 ballots that have been unveiled by their voters in a column, out of a likely 570 or so that will be cast (although that hardly seems predictive of this year's total, due to the ridiculously controversial ballot—it could stimulate interest and produce a record-high number of ballots, or so many people could be disgusted or bewildered by their choices that the number takes a substantial hit). According to BBTF's poll, no player has 75% of the vote; Craig Biggio, with 69.9%, comes the closest.
But exit polls, as John Kerry so famously learned, can be wrong. Can we determine how wrong they might be? Not for sure, but we can look at the historical performance of the same types of exit polls.
For the past five years, @leokitty has kept a spreadsheet tallying the percentage of votes each player got in the columns released that year. Here is how the figures compared last year, when the sample size was 114 out of an eventual 573 ballots cast (19.9%):
For the class of 2011, she unearthed 122 votes online out of an eventual 581 (21.0%):
And for the class of 2010, only 92 of an eventual 539 ballots (17.1%) were pre-countable:
Obviously any poll comes with a margin of error. However, there are some players whose vote totals are consistently over- or under-predicted by these surveys, just as political polls tend to undersample minorities and the young. Knowing this can tell us a lot about what we might be able to expect on Wednesday.
Specifically, the broad trend appears to be that the exit polls understate support for "old-school" candidates or candidates whose best case for inclusion is superficial. Such candidates include Lee Smith (with his eye-popping quantity of saves), Don Mattingly (the quintessential "professional hitter"), Larry Walker (looked great, but who doesn't at Coors Field?), and Jack Morris (everyone remembers him for that one dominant World Series start).
Another trend is that the exit polls overstate support for SABR-friendly candidates—or, more precisely, they just really overvalue poor Tim Raines. Interestingly, the polls do not seem biased toward or against any of the steroid-tainted characters.
This paints a picture of an polling sample (self-selected, remember; they are the ones who choose to write columns publishing their ballot for all to see) that is more pro-SABR and, if you'll excuse the editorialization, more forward-thinking than the electorate as a whole. This makes sense—a lot of the old-school voters (their minds calcified in an old way of thinking, like that wins and saves are important statistics) are no longer covering baseball, and thus don't have column space to devote to an explanation of their ballot. Similarly, some of the more closed-minded BBWAA members may not be interesting in sharing their ballot with the world, therefore exposing them to be ripped to shreds in comments sections and on Twitter.
So what does this mean for Wednesday's final vote tally, other than that Tim Raines is going to see yet another big dropoff? In the chart below, I've taken each player's current projected vote share as assessed by BBTF and added an adjustment factor, based on the player's average deviation from the exit-poll results in the past three years. For new candidates on the ballot, I've added no such adjustment factor (they are mostly steroid candidates anyway, and that issue has shown to have little effect on the accuracy of exit polls).
So it does indeed look grim. Even with the adjustments, Biggio remains closest. Can he make it? To be honest, looking at these numbers, I doubt it. He doesn't strike me as an old-school candidate; if anything, he's closer to the subtle greatness of Roberto Alomar and Barry Larkin, who were both overvalued by polls before. (But he is also white, which neither Alomar nor Larkin nor Raines is—could this also be a creeping factor?) Meanwhile, the top candidate likely to benefit from the old-school swing, Jack Morris, simply has too much ground to make up. He's currently polling at 62.4%, and while he is almost certain to get more than that on Wednesday, a 12.6-point bump would be unprecedented. If the old-schoolers directed their love to another, closer candidate—Jeff Bagwell—we'd have a decent shot at an induction, but Bagwell has been on the ballot for two years now and has shown no tendency to deviate from the polls. So all that brings us to the real question:
What if they had a Hall of Fame induction but nobody came?
Friday, December 21, 2012
What's So Special About $13 Million?
I should start off by saying that if this feels a little conspiracy-theory-ish, that's because it is. I may be being too paranoid, but no one else is really talking about this, so I thought I would at least point it out.
Dedicated observers of the hot stove have been experiencing déjà vu this MLB offseason. If you've been feeling unlucky, it's not just in your head; the number "13" has popped up unusually frequently in final contract numbers:
This doesn't count Andy Pettitte (signed with the Yankees for one year, $12 million with incentives that could bring him to $13 million), Kevin Youkilis (signed with the Yankees for one year, $12 million), and RA Dickey (signed an extension with the Blue Jays for two years, $25 million).
What is going on here? At first, I figured it was a coincidence, but now I'm not so sure. There certainly seems to be an informal cap on the annual salaries given out to free agents this year. Oh, to be sure, elite free agents have broken the bank, such as Zack Greinke's $24.5 million AAV and Josh Hamilton's $25 million. Teams rightly have no problem breaking the magic barrier and doing everything in their power to secure a superstar—but the mid-level free agents have a very specific value on the free market, it seems.
This raises the question of whether it really is a free market. To be clear, I am not making an accusation—but any time the numbers line up like this, it raises the specter of collusion. Collusion may seem extreme and far-fetched, but it has been pretty common throughout baseball history, including recently, if you believe the MLBPA. It's actually not that outrageous of a possibility. What we know is that there has been an unusually high number of identically valued contracts this offseason, whether by secret, explicit arrangement between teams or an unspoken consensus around the league that $13 million is where the bidding stops.
In the mystery of whether there is anything deeper—or sinister—behind this study in numerology, a potential clue is the revamped system of free-agent compensation in the new CBA. (If you're not familiar with it, a good explanation is here.) The value of the "qualifying offers" that teams extend to their free agents under this system is calculated from the average of the 125 highest player salaries. In another eyebrow-raising coincidence, the value of a qualifying offer this year was $13.3 million.
There are numerous inferences to draw here. The simplest is that teams are simply trying to artificially depress the value of the qualifying offer (or at least keep it steady at roughly $13 million). That could be part of it, but there are also more complex forces potentially at play here.
To date, only five players (Josh Hamilton, Zack Greinke, BJ Upton, Aníbal Sánchez, and Hiroki Kuroda) have signed for higher AAVs than the value of a qualifying offer. Others (Nick Swisher, Michael Bourn, Kyle Lohse) figure to do so as well in the near future. All of these players were either extended qualifying offers or were not eligible for them (due to being traded midseason). In contrast, no player who didn't receive a qualifying offer is expected to get a higher AAV than $13 million.
Indeed, that's exactly what they have been getting: $13 million per year. That's a sign that maybe the market for non-qualifying-offer players is still strong—perhaps strong enough to reach $14 million or $15 million if unencumbered. But teams have an incentive to encumber—and to set the "ceiling" for these B-level free agents' salaries at a number just a tad below the value of a qualifying offer.
The incentive is to discourage other teams from making qualifying offers in the future. If any non-qualifying-offer free agent did receive a contract bigger than $13.3 million, teams would take note of this missed opportunity to gain a draft pick and might be more liberal in extending qualifying offers after 2013 or 2014. A given team doesn't want the other 29 to realize and do that, however, because it means that it would have to give up a draft pick if it wanted to sign that free agent. The fewer qualifying offers that are extended, the more aggressive teams can be on the free-agent market because the fewer draft picks they'll lose in doing so.
This scenario assumes that the clump of contracts around $13 million is meant to influence other teams' decisions on extending qualifying offers. But it could also be a way to influence players' decisions on whether to accept them.
Say MLB teams are all colluding to keep non-qualifying-offer free agents at AAVs under $13.3 million. The flip side of that is that teams are allowed to go berserk over qualifying-offer free agents; they're the only ones left to throw money at. This ensures that no qualifying-offer free agent ever settles for an AAV less than $13.3 million. Then, in future years, players who receive qualifying offers look at the history of past free agents in the same position and see that they would be stupid to accept one year at "only" $13.3 million. It then becomes easier for teams to extend qualifying offers—and thus easier to secure an extra draft pick—with less of a fear that their players will accept the offer, which the team may not truly be interested in paying.
This is a rather opposite scenario from the other; both seem like plausible possibilities, though. I'm sure others, even more complicated, could be thought up too. I don't presume to know the real reason for the cluster at $13 million, and, again, I'm not making a specific accusation. It's worth some very critical thought, though.
Dedicated observers of the hot stove have been experiencing déjà vu this MLB offseason. If you've been feeling unlucky, it's not just in your head; the number "13" has popped up unusually frequently in final contract numbers:
| Player | New Team | Dollars | Length | AAV |
|---|---|---|---|---|
| David Ortiz | Red Sox | $26 million | 2 years | $13 million |
| Torii Hunter | Tigers | $26 million | 2 years | $13 million |
| Dan Haren | Nationals | $13 million | 1 year | $13 million |
| Mike Napoli | Red Sox | $39 million | 3 years | $13 million |
| Shane Victorino | Red Sox | $39 million | 3 years | $13 million |
| Ryan Dempster | Red Sox | $26.5 million | 2 years | $13.25 million |
| Edwin Jackson | Cubs | $52 million | 4 years | $13 million |
This doesn't count Andy Pettitte (signed with the Yankees for one year, $12 million with incentives that could bring him to $13 million), Kevin Youkilis (signed with the Yankees for one year, $12 million), and RA Dickey (signed an extension with the Blue Jays for two years, $25 million).
What is going on here? At first, I figured it was a coincidence, but now I'm not so sure. There certainly seems to be an informal cap on the annual salaries given out to free agents this year. Oh, to be sure, elite free agents have broken the bank, such as Zack Greinke's $24.5 million AAV and Josh Hamilton's $25 million. Teams rightly have no problem breaking the magic barrier and doing everything in their power to secure a superstar—but the mid-level free agents have a very specific value on the free market, it seems.
This raises the question of whether it really is a free market. To be clear, I am not making an accusation—but any time the numbers line up like this, it raises the specter of collusion. Collusion may seem extreme and far-fetched, but it has been pretty common throughout baseball history, including recently, if you believe the MLBPA. It's actually not that outrageous of a possibility. What we know is that there has been an unusually high number of identically valued contracts this offseason, whether by secret, explicit arrangement between teams or an unspoken consensus around the league that $13 million is where the bidding stops.
In the mystery of whether there is anything deeper—or sinister—behind this study in numerology, a potential clue is the revamped system of free-agent compensation in the new CBA. (If you're not familiar with it, a good explanation is here.) The value of the "qualifying offers" that teams extend to their free agents under this system is calculated from the average of the 125 highest player salaries. In another eyebrow-raising coincidence, the value of a qualifying offer this year was $13.3 million.
There are numerous inferences to draw here. The simplest is that teams are simply trying to artificially depress the value of the qualifying offer (or at least keep it steady at roughly $13 million). That could be part of it, but there are also more complex forces potentially at play here.
To date, only five players (Josh Hamilton, Zack Greinke, BJ Upton, Aníbal Sánchez, and Hiroki Kuroda) have signed for higher AAVs than the value of a qualifying offer. Others (Nick Swisher, Michael Bourn, Kyle Lohse) figure to do so as well in the near future. All of these players were either extended qualifying offers or were not eligible for them (due to being traded midseason). In contrast, no player who didn't receive a qualifying offer is expected to get a higher AAV than $13 million.
Indeed, that's exactly what they have been getting: $13 million per year. That's a sign that maybe the market for non-qualifying-offer players is still strong—perhaps strong enough to reach $14 million or $15 million if unencumbered. But teams have an incentive to encumber—and to set the "ceiling" for these B-level free agents' salaries at a number just a tad below the value of a qualifying offer.
The incentive is to discourage other teams from making qualifying offers in the future. If any non-qualifying-offer free agent did receive a contract bigger than $13.3 million, teams would take note of this missed opportunity to gain a draft pick and might be more liberal in extending qualifying offers after 2013 or 2014. A given team doesn't want the other 29 to realize and do that, however, because it means that it would have to give up a draft pick if it wanted to sign that free agent. The fewer qualifying offers that are extended, the more aggressive teams can be on the free-agent market because the fewer draft picks they'll lose in doing so.
This scenario assumes that the clump of contracts around $13 million is meant to influence other teams' decisions on extending qualifying offers. But it could also be a way to influence players' decisions on whether to accept them.
Say MLB teams are all colluding to keep non-qualifying-offer free agents at AAVs under $13.3 million. The flip side of that is that teams are allowed to go berserk over qualifying-offer free agents; they're the only ones left to throw money at. This ensures that no qualifying-offer free agent ever settles for an AAV less than $13.3 million. Then, in future years, players who receive qualifying offers look at the history of past free agents in the same position and see that they would be stupid to accept one year at "only" $13.3 million. It then becomes easier for teams to extend qualifying offers—and thus easier to secure an extra draft pick—with less of a fear that their players will accept the offer, which the team may not truly be interested in paying.
This is a rather opposite scenario from the other; both seem like plausible possibilities, though. I'm sure others, even more complicated, could be thought up too. I don't presume to know the real reason for the cluster at $13 million, and, again, I'm not making a specific accusation. It's worth some very critical thought, though.
Monday, November 19, 2012
Crystal-Ball Report Card: 2012 Season
We're entering a lull in prediction season, but that doesn't mean we're done talking about predictions. It's easy for people to make forecasts, but disappointingly few follow up on them to see how they shook out—and, even then, it's usually only the people who hit the nail on the head looking to gloat. In the name of accountability, I wanted to look back on the predictions I've made over the past year—and hopefully learn something about more accurate forecasting in the future as a result.
Specifically, I want to take a look at my predictions for the 2012 MLB season, broken down by division: AL East, AL Central, AL West, NL East, NL Central, and NL West. More recently, I also made picks about how I thought the November elections would go, but (a) I've hashed through those pretty well on Twitter and (b) I don't think an article in which I gloat about hitting the nail on the head would be very interesting. My MLB predictions, on the other hand, were much more of a mixed bag.
Back in March and April, I calculated the specific win-loss records that I thought each team would end the season with. Let's start by looking at how I did with the raw numbers:

Next we'll dive into some of the specific claims I made.
Prediction: Both the Orioles and Athletics would stink up the joint on their ways to respective last-place finishes.
What Really Happened: In my defense, I said that the Orioles were "hardly an atrocious team and have the potential to play some watchable ball this year"; I called the Athletics "the division's most interesting—and most unpredictable—team." But no one could have predicted all those Ws. The A's and O's stunned the baseball world by threatening all season to win their respective divisions—two of the strongest in baseball. My error was in overestimating the strength of some of the other teams in those brackets. I was convinced that the Rangers and Angels would both be powerhouses; instead, the $55 million A's stole the division crown from both of them. I was particularly wrong about the Angels, whose shaky starting pitching caused them to win 11 fewer games than I thought they would.
Prediction: The Red Sox would not be a playoff team, but they would win 88 games.
What Really Happened: The Red Sox lost 90 games for the first time since 1965. This was a team that completely imploded under the leadership—if you can call it that—of Bobby Valentine. More relevantly, Boston's pitching just fell apart. I was skeptical about the team because I saw that it had "only two sure-thing starters (Jon Lester and Josh Beckett)" plus a handful of pitchers with promise. It turns out that none of that promise was fulfilled (Daniel Bard, in particular, was a mess) and their sure things forgot how to make outs. At the very least, my observation that, "when they bled, they could not clot" proved accurate, as the franchise hemorrhaged losses and fans all year long.
Prediction: The Tigers would win the AL Central, but more by default than domination; the team would actually be kind of mediocre, with only 89 wins.
What Really Happened: Exactly that... sort of. The Tigers limped to the division crown with 88 wins thanks to the same liabilities that I predicted: a ghastly defense and a middling offense. I correctly called Alex Avila's and Jhonny Peralta's falls back down to earth, though I also wrongly called out Austin Jackson for being an underachiever. But then, of course, the whole team made me feel a little silly when it dominated its way to the World Series.
Prediction: The White Sox would finish second in the AL Central. Jake Peavy, Chris Sale, Gavin Floyd, and John Danks would form a dominating starting rotation; Adam Dunn would bounce back to become a middle-of-the-order threat.
What Really Happened: The White Sox did even better than I expected (I still had them finishing slightly below .500), getting bounceback seasons out of not only Adam Dunn, but also Alex Ríos, whom I had given up on. Gavin Floyd wasn't reliable, and John Danks was lost to injury, but the rest of the pitching staff stepped up to fall just short of the fewest runs allowed in the division. I was particularly prophetic on the seasons of prospect Sale and injury question mark Peavy.
Prediction: Of the top four teams in the NL East, "each team is capable of dominating to the tune of 100 wins (yes, even the Nationals), and each team could collapse like a house of cards to below .500 (yes, even the Phillies). The one certainty—and, in my opinion, the safest bet in all of baseball this year—is that a certain team from New York will sink comfortably to the bottom."
What Really Happened: What was certain was wrong, and what seemed fanciful became reality. The Mets finished fourth in the NL East, guaranteeing my premature retirement from sports gambling; I foresaw Johan Santana's inconsistency and Jason Bay's suckitude but failed to account for David Wright's resurgence and the force of nature that is RA Dickey. Meanwhile, the Nats came close to those 100 wins and the Phillies finished at exactly .500. This fascinating division deserves some more broken-down analysis, though...
Prediction: Reports of the Phillies' demise would be greatly exaggerated. While the loss of Roy Oswalt would take a few wins off their 2011 total, they would still be a dominating pitching team and the class of the National League.
What Really Happened: Uh, oops. Many others saw this coming, but I guess I missed the warning signs. Roy Halladay lost time due to injury, and even when he pitched, he was mediocre (4.49 ERA); meanwhile, Cliff Lee forgot how to win (only six of them over a full year). As a result, they had only the division's third-best pitching. I was slightly redeemed when it turned out that the Philadelphia offense, which everyone else saw as ripe for a collapse, only weakened incrementally—consistent with what happens when a team gets one year older. Still, my claim that Philly would have "the best offense in the division" due to others' weakness was way off base (they had the third-best).
Prediction: The Nats would be the breakout team of 2012, pitching their way to a playoff berth. The additions of Edwin Jackson, Gio González, and Stephen Strasburg (back from injury) would add anywhere from nine to 18 wins to their total of 80 from 2011, and they would possibly lead the majors in ERA.
What Really Happened: It was 18 wins, not nine, and they had the second-best ERA in the majors, but I nailed everything else. The Nats as contenders was one of the preseason predictions I argued most forcefully for, and I didn't see a way (beyond injury) that their fearsome foursome of starters wouldn't improve the Nats' fortunes dramatically. What I didn't see was that their offense would mature as well; they had the division's best. Maybe I should have, though—I specifically predicted that Adam LaRoche's 25-home-run power would return (he hit 33).
Prediction: Brandon Beachy and Mike Minor—not the injury-prone Tim Hudson and Tommy Hanson—would lead the Braves to a Wild Card berth.
What Really Happened: Beachy was dominant but was lost to Tommy John surgery in June. Minor ended up struggling to a 4.12 ERA, and Hanson was actually healthy all year—though he also provided lukewarm results. It was pitchers who came out of seemingly nowhere to give the Braves their boost: Paul Maholm, acquired in a trade from the Cubs, and Kris Medlen, whose 1.57 ERA in 138 innings remains the seminal stat of the 2012 Braves season. But hey, at least I got the Wild Card berth right.
Prediction: The Marlins would finish in fourth place with only 85 wins, the victims of overrated offseason signings.
What Really Happened: The Marlins did a lot worse, losing 16 more games than I thought. But, in my defense, the tone of my Marlins preseason rundown was hardly positive. I saw the José Reyes signing as akin to adding an average shortstop, the Heath Bell signing as basically pointless (most relievers are), and the Mark Buehrle signing as useful, but only to replace the likely-to-be-injured Josh Johnson (for a net gain of zero). Reyes ended up avoiding the DL and being a quality regular, but he couldn't make up for the absence (in spirit and then in reality) of Hanley Ramírez's potent bat from the middle of the lineup. Where I was most wrong was in saying that, while they would not make the playoffs because they had so much ground to make up, "this is an improved team, no question"; turns out there was a question, as they lost three more games than in 2011.
Prediction: The Brewers would win the NL Central. Aramis Ramírez would replace Prince Fielder's pop in the lineup, and their 2011-division-winning pitching staff would continue to be quietly solid.
What Really Happened: I truly believe the Brewers would have won the division again in 2012 if their pitching staff—specifically, their bullpen—hadn't been so very loudly awful. The Brewers actually scored 55 more runs in 2012 than they did with Fielder in 2011; Ramírez filled in very nicely, turning in an even better season than his excellent 2011. Their starters also had a 3.99 ERA, again jibing with my prognostication. Their bullpen, however, was the league's worst, with a 4.66 ERA, 33 losses, and 29 blown saves! With bullpen performance being one of the most fickle things about baseball from year to year, if Milwaukee could play the season over, I think they'd have a different result. Look, too, for them to improve almost automatically in 2013.
Prediction: The Reds were overhyped and would finish third with 86 wins; 90 would be their ceiling due to a mediocre starting staff.
What Really Happened: The Reds made me look like an idiot; Cincinnati was this close from finishing with the top record in baseball. What did me in was the rock-solidness of the Reds rotation; their main five started 161 of the team's 162 games. Bronson Arroyo and Homer Bailey both spun phenomenal seasons, especially considering the ballpark they call home, and Mat Latos was much more of an impact player than I had foreseen. I never would have dreamed that together they would give up the fewest runs in the National League.
Prediction: This would be the year the Pirates seriously challenge for a winning season, but ultimately they would fall short, with 76 wins.
What Really Happened: The work of the devil, apparently. The Pirates stormed off to a great start, realizing more potential than even I thought they had in them. But, famously, the Bucs stopped there, plummeting to a 79-win finish. While I couldn't have predicted the wild ride, my final guess was pretty well on target. My February argument about the strength of the Pittsburgh rotation also proved prescient as the reason for Pirates fans' early-summer hope. It turns out they only had the NL Central's third-best pitching, however, not second-best as I had envisioned.
Prediction: The Astros, Cubs, and Twins would be among the worst teams in baseball, winning 55, 62, and 67 games respectively.
What Really Happened: The Astros, Cubs, and Twins were among the worst teams in baseball, winning 55, 61, and 66 games respectively. Sometimes, the worst teams are the easiest to predict, though I did put my neck out a bit when I said only four Twins would hit double-digit home runs (Joe Mauer, Justin Morneau, Josh Willingham, and Danny Valencia). I was wrong about Valencia and failed to include Trevor Plouffe (whose sudden power surge must qualify as the surprise of the 2012 AL Central) and Ryan Doumit (who barely made it himself, hitting 10 homers), but the basic idea held true: Target Field saps power.
Prediction: "I don't see how [the Diamondbacks' excellent 2011] couldn't be [for real], though, for it was built on an extremely solid foundation... it would be more surprising if [Ian Kennedy and Daniel Hudson] regressed this year, considering the promise that was held for them when they were minor leaguers." The Diamondbacks would once again win the NL West, though with only 88 wins in this weak division.
What Really Happened: The Diamondbacks did return the NL West's second-best offense and second-best pitching. That should have been good for second, if not first, place, and indeed it did produce a Pythagorean record of 86–76. But reality intervened, and the DBacks finished third with 81 wins—not an altogether terrible prediction, but clearly a miss. To blame were Daniel Hudson's Tommy John surgery, Justin Upton's average output, and Ian Kennedy's blah 4.02 ERA.
Prediction: The Rockies would be MLB's biggest surprise in 2012. The rotation would put it all together for at least 85 wins. "If things break right, Colorado could run away with the division title."
What Really Happened: Things, ah, did not break right. The Rockies lost 98 games and were my worst overestimation of the offseason. Specifically, that starting staff I was so optimistic about was so bad that the team switched to a four-man rotation, limiting starters to 75 pitches each. It was a failed experiment, and Colorado starters finished with a 5.81 ERA. Drew Pomeranz did not dominate over a full season as I boldly predicted, and my diamonds in the rough Jeremy Guthrie and Jamie Moyer lasted a collective five months in the rotation. Finally, Jhoulys Chacín and Juan Nicasio both failed to come back from injuries, leaving the pitching cupboard bare. The best laid plans of mice and men...
Prediction: The Dodgers would fight to stay out of the cellar, lacking any kind of supporting cast for Matt Kemp and Clayton Kershaw. They would finish with 74 wins.
What Really Happened: The Dodgers loaded up on cash and bought (literally) a whole team, including Hanley Ramírez, Shane Victorino, Adrian González, and Joe Blanton. I was actually right about James Loney and Dee Gordon crashing and burning this year, but I didn't expect all-stars to take over their positions. Personally, I don't think anyone can be held to their preseason Dodgers prediction, since the team that ended 2012 in Chavez Ravine simply bore no resemblance to the one that started it. A solid rotation was also something I underestimated, however, as the Dodgers played the role of Cincinnati with four consistent starters with ERAs under 3.73.
Prediction: The Giants "appear to have hit a ceiling with their two-way low-score strategy." Without a reliable offense, they would limp to 84 wins and third place. Melky Cabrera would return to being an out machine, though Aubrey Huff would manage to resurrect his career (yet again). Ryan Vogelsong would discover mediocrity, and Barry Zito would continue his.
What Really Happened: The 2012 World Series champions, that's what happened. Virtually all my predictions turned out the exact opposite: Zito found new life, Vogelsong seems to have achieved a new normal, Cabrera was unreal (as was, it turns out, his newfound muscle), and Huff turned in fewer than 100 at-bats. Meanwhile, Buster Posey led a truly shockingly good offense of the kind San Francisco has lacked since Barry Bonds. I could've told you in the spring that, with that kind of offense, the Giants would be World Series favorites. But I couldn't and I didn't—and that's why you can't predict baseball.
Specifically, I want to take a look at my predictions for the 2012 MLB season, broken down by division: AL East, AL Central, AL West, NL East, NL Central, and NL West. More recently, I also made picks about how I thought the November elections would go, but (a) I've hashed through those pretty well on Twitter and (b) I don't think an article in which I gloat about hitting the nail on the head would be very interesting. My MLB predictions, on the other hand, were much more of a mixed bag.
Back in March and April, I calculated the specific win-loss records that I thought each team would end the season with. Let's start by looking at how I did with the raw numbers:
Next we'll dive into some of the specific claims I made.
Prediction: Both the Orioles and Athletics would stink up the joint on their ways to respective last-place finishes.
What Really Happened: In my defense, I said that the Orioles were "hardly an atrocious team and have the potential to play some watchable ball this year"; I called the Athletics "the division's most interesting—and most unpredictable—team." But no one could have predicted all those Ws. The A's and O's stunned the baseball world by threatening all season to win their respective divisions—two of the strongest in baseball. My error was in overestimating the strength of some of the other teams in those brackets. I was convinced that the Rangers and Angels would both be powerhouses; instead, the $55 million A's stole the division crown from both of them. I was particularly wrong about the Angels, whose shaky starting pitching caused them to win 11 fewer games than I thought they would.
Prediction: The Red Sox would not be a playoff team, but they would win 88 games.
What Really Happened: The Red Sox lost 90 games for the first time since 1965. This was a team that completely imploded under the leadership—if you can call it that—of Bobby Valentine. More relevantly, Boston's pitching just fell apart. I was skeptical about the team because I saw that it had "only two sure-thing starters (Jon Lester and Josh Beckett)" plus a handful of pitchers with promise. It turns out that none of that promise was fulfilled (Daniel Bard, in particular, was a mess) and their sure things forgot how to make outs. At the very least, my observation that, "when they bled, they could not clot" proved accurate, as the franchise hemorrhaged losses and fans all year long.
Prediction: The Tigers would win the AL Central, but more by default than domination; the team would actually be kind of mediocre, with only 89 wins.
What Really Happened: Exactly that... sort of. The Tigers limped to the division crown with 88 wins thanks to the same liabilities that I predicted: a ghastly defense and a middling offense. I correctly called Alex Avila's and Jhonny Peralta's falls back down to earth, though I also wrongly called out Austin Jackson for being an underachiever. But then, of course, the whole team made me feel a little silly when it dominated its way to the World Series.
Prediction: The White Sox would finish second in the AL Central. Jake Peavy, Chris Sale, Gavin Floyd, and John Danks would form a dominating starting rotation; Adam Dunn would bounce back to become a middle-of-the-order threat.
What Really Happened: The White Sox did even better than I expected (I still had them finishing slightly below .500), getting bounceback seasons out of not only Adam Dunn, but also Alex Ríos, whom I had given up on. Gavin Floyd wasn't reliable, and John Danks was lost to injury, but the rest of the pitching staff stepped up to fall just short of the fewest runs allowed in the division. I was particularly prophetic on the seasons of prospect Sale and injury question mark Peavy.
Prediction: Of the top four teams in the NL East, "each team is capable of dominating to the tune of 100 wins (yes, even the Nationals), and each team could collapse like a house of cards to below .500 (yes, even the Phillies). The one certainty—and, in my opinion, the safest bet in all of baseball this year—is that a certain team from New York will sink comfortably to the bottom."
What Really Happened: What was certain was wrong, and what seemed fanciful became reality. The Mets finished fourth in the NL East, guaranteeing my premature retirement from sports gambling; I foresaw Johan Santana's inconsistency and Jason Bay's suckitude but failed to account for David Wright's resurgence and the force of nature that is RA Dickey. Meanwhile, the Nats came close to those 100 wins and the Phillies finished at exactly .500. This fascinating division deserves some more broken-down analysis, though...
Prediction: Reports of the Phillies' demise would be greatly exaggerated. While the loss of Roy Oswalt would take a few wins off their 2011 total, they would still be a dominating pitching team and the class of the National League.
What Really Happened: Uh, oops. Many others saw this coming, but I guess I missed the warning signs. Roy Halladay lost time due to injury, and even when he pitched, he was mediocre (4.49 ERA); meanwhile, Cliff Lee forgot how to win (only six of them over a full year). As a result, they had only the division's third-best pitching. I was slightly redeemed when it turned out that the Philadelphia offense, which everyone else saw as ripe for a collapse, only weakened incrementally—consistent with what happens when a team gets one year older. Still, my claim that Philly would have "the best offense in the division" due to others' weakness was way off base (they had the third-best).
Prediction: The Nats would be the breakout team of 2012, pitching their way to a playoff berth. The additions of Edwin Jackson, Gio González, and Stephen Strasburg (back from injury) would add anywhere from nine to 18 wins to their total of 80 from 2011, and they would possibly lead the majors in ERA.
What Really Happened: It was 18 wins, not nine, and they had the second-best ERA in the majors, but I nailed everything else. The Nats as contenders was one of the preseason predictions I argued most forcefully for, and I didn't see a way (beyond injury) that their fearsome foursome of starters wouldn't improve the Nats' fortunes dramatically. What I didn't see was that their offense would mature as well; they had the division's best. Maybe I should have, though—I specifically predicted that Adam LaRoche's 25-home-run power would return (he hit 33).
Prediction: Brandon Beachy and Mike Minor—not the injury-prone Tim Hudson and Tommy Hanson—would lead the Braves to a Wild Card berth.
What Really Happened: Beachy was dominant but was lost to Tommy John surgery in June. Minor ended up struggling to a 4.12 ERA, and Hanson was actually healthy all year—though he also provided lukewarm results. It was pitchers who came out of seemingly nowhere to give the Braves their boost: Paul Maholm, acquired in a trade from the Cubs, and Kris Medlen, whose 1.57 ERA in 138 innings remains the seminal stat of the 2012 Braves season. But hey, at least I got the Wild Card berth right.
Prediction: The Marlins would finish in fourth place with only 85 wins, the victims of overrated offseason signings.
What Really Happened: The Marlins did a lot worse, losing 16 more games than I thought. But, in my defense, the tone of my Marlins preseason rundown was hardly positive. I saw the José Reyes signing as akin to adding an average shortstop, the Heath Bell signing as basically pointless (most relievers are), and the Mark Buehrle signing as useful, but only to replace the likely-to-be-injured Josh Johnson (for a net gain of zero). Reyes ended up avoiding the DL and being a quality regular, but he couldn't make up for the absence (in spirit and then in reality) of Hanley Ramírez's potent bat from the middle of the lineup. Where I was most wrong was in saying that, while they would not make the playoffs because they had so much ground to make up, "this is an improved team, no question"; turns out there was a question, as they lost three more games than in 2011.
Prediction: The Brewers would win the NL Central. Aramis Ramírez would replace Prince Fielder's pop in the lineup, and their 2011-division-winning pitching staff would continue to be quietly solid.
What Really Happened: I truly believe the Brewers would have won the division again in 2012 if their pitching staff—specifically, their bullpen—hadn't been so very loudly awful. The Brewers actually scored 55 more runs in 2012 than they did with Fielder in 2011; Ramírez filled in very nicely, turning in an even better season than his excellent 2011. Their starters also had a 3.99 ERA, again jibing with my prognostication. Their bullpen, however, was the league's worst, with a 4.66 ERA, 33 losses, and 29 blown saves! With bullpen performance being one of the most fickle things about baseball from year to year, if Milwaukee could play the season over, I think they'd have a different result. Look, too, for them to improve almost automatically in 2013.
Prediction: The Reds were overhyped and would finish third with 86 wins; 90 would be their ceiling due to a mediocre starting staff.
What Really Happened: The Reds made me look like an idiot; Cincinnati was this close from finishing with the top record in baseball. What did me in was the rock-solidness of the Reds rotation; their main five started 161 of the team's 162 games. Bronson Arroyo and Homer Bailey both spun phenomenal seasons, especially considering the ballpark they call home, and Mat Latos was much more of an impact player than I had foreseen. I never would have dreamed that together they would give up the fewest runs in the National League.
Prediction: This would be the year the Pirates seriously challenge for a winning season, but ultimately they would fall short, with 76 wins.
What Really Happened: The work of the devil, apparently. The Pirates stormed off to a great start, realizing more potential than even I thought they had in them. But, famously, the Bucs stopped there, plummeting to a 79-win finish. While I couldn't have predicted the wild ride, my final guess was pretty well on target. My February argument about the strength of the Pittsburgh rotation also proved prescient as the reason for Pirates fans' early-summer hope. It turns out they only had the NL Central's third-best pitching, however, not second-best as I had envisioned.
Prediction: The Astros, Cubs, and Twins would be among the worst teams in baseball, winning 55, 62, and 67 games respectively.
What Really Happened: The Astros, Cubs, and Twins were among the worst teams in baseball, winning 55, 61, and 66 games respectively. Sometimes, the worst teams are the easiest to predict, though I did put my neck out a bit when I said only four Twins would hit double-digit home runs (Joe Mauer, Justin Morneau, Josh Willingham, and Danny Valencia). I was wrong about Valencia and failed to include Trevor Plouffe (whose sudden power surge must qualify as the surprise of the 2012 AL Central) and Ryan Doumit (who barely made it himself, hitting 10 homers), but the basic idea held true: Target Field saps power.
Prediction: "I don't see how [the Diamondbacks' excellent 2011] couldn't be [for real], though, for it was built on an extremely solid foundation... it would be more surprising if [Ian Kennedy and Daniel Hudson] regressed this year, considering the promise that was held for them when they were minor leaguers." The Diamondbacks would once again win the NL West, though with only 88 wins in this weak division.
What Really Happened: The Diamondbacks did return the NL West's second-best offense and second-best pitching. That should have been good for second, if not first, place, and indeed it did produce a Pythagorean record of 86–76. But reality intervened, and the DBacks finished third with 81 wins—not an altogether terrible prediction, but clearly a miss. To blame were Daniel Hudson's Tommy John surgery, Justin Upton's average output, and Ian Kennedy's blah 4.02 ERA.
Prediction: The Rockies would be MLB's biggest surprise in 2012. The rotation would put it all together for at least 85 wins. "If things break right, Colorado could run away with the division title."
What Really Happened: Things, ah, did not break right. The Rockies lost 98 games and were my worst overestimation of the offseason. Specifically, that starting staff I was so optimistic about was so bad that the team switched to a four-man rotation, limiting starters to 75 pitches each. It was a failed experiment, and Colorado starters finished with a 5.81 ERA. Drew Pomeranz did not dominate over a full season as I boldly predicted, and my diamonds in the rough Jeremy Guthrie and Jamie Moyer lasted a collective five months in the rotation. Finally, Jhoulys Chacín and Juan Nicasio both failed to come back from injuries, leaving the pitching cupboard bare. The best laid plans of mice and men...
Prediction: The Dodgers would fight to stay out of the cellar, lacking any kind of supporting cast for Matt Kemp and Clayton Kershaw. They would finish with 74 wins.
What Really Happened: The Dodgers
Prediction: The Giants "appear to have hit a ceiling with their two-way low-score strategy." Without a reliable offense, they would limp to 84 wins and third place. Melky Cabrera would return to being an out machine, though Aubrey Huff would manage to resurrect his career (yet again). Ryan Vogelsong would discover mediocrity, and Barry Zito would continue his.
What Really Happened: The 2012 World Series champions, that's what happened. Virtually all my predictions turned out the exact opposite: Zito found new life, Vogelsong seems to have achieved a new normal, Cabrera was unreal (as was, it turns out, his newfound muscle), and Huff turned in fewer than 100 at-bats. Meanwhile, Buster Posey led a truly shockingly good offense of the kind San Francisco has lacked since Barry Bonds. I could've told you in the spring that, with that kind of offense, the Giants would be World Series favorites. But I couldn't and I didn't—and that's why you can't predict baseball.
Sunday, November 4, 2012
Predicting the 2012 Election
In a recent post, I explained why "calling" races and making predictions based on qualitative, not quantitative, factors was iffy at best and academically irresponsible at worst. So, naturally, what follows will be my arbitrary and binary predictions for the 2012 elections.
(In seriousness, I do want to make it clear that this is in no way a scientific prediction. But I also don't think there's anything wrong with that, as long as it's acknowledged up front and everything that follows is kept in its proper perspective. Making predictions, as pundits do on Baseball Tonight or the World Series pregame show or whatever, is fun, and it's nothing I would begrudge anyone. I just wish punditry would be seen for what it is—entertainment.)
Here, my prediction will be the roughest and, probably, the most uninformed. Unfortunately, I haven't had a chance this cycle to look at the competitive House races in much depth. In 2006, 2008, and 2010, we had the benefit of knowing it was a "wave election," but there is no such trend this year. The consensus among experts is that there may be a slight Democratic edge (as in the Senate and presidential races), but it's close to a draw. If the parties split the tossup seats, Democrats would net only a handful—zero to five seems to be the generally agreed-upon range. Looking at the roster of competitive races, though, I find a bit more to like for Democrats. Going through this list, keeping score based on my sense of each race, and then splitting my own personal "tossups" 50-50, I make a back-of-the-napkin guess that the next House will consist of 202 Democrats and 233 Republicans.
In the underrated governors' races, I have already provided my overall rankings in the form of a spectrum accessible via the tab on the top of the page. This year, there are four clear Democratic favorites and four clear Republican favorites; you can see my picks for those on the Gubernatorial Rankings page. But what of the three tossups: Washington, New Hampshire, and Montana?
Well, the way the chart works is that I order the races from most Democratic to most Republican, so the tossup closest to the blue side is the one most likely to go blue and vice versa. However, I should emphasize that the reason I ever place any race in the "tossup" category is that it truly is too close to call—by definition, that there's nothing that gives me a hint the race is leading one way or the other. I'll pick them for you here—again, for entertainment purposes only—but know that it's a stab in the dark.
I'm going to say that Montana's next governor will be Republican Rick Hill, while Washington and New Hampshire will elect Democrats. In Montana, I expect that presidential coattails (i.e., the fact that Mitt Romney will win the state handily) will outweigh the coattails of an outgoing Democratic governor who's not on the ballot. In Washington, likewise, Barack Obama's easy win should help drive Jay Inslee–inclined supporters to the voting booth. Furthermore, Inslee has enjoyed a slight polling lead for a few months now, with the race only just recently drifting into the margin of error. In New Hampshire, the opposite has occurred, with Democrat Maggie Hassan coming off a strong set of polls showing her up four points, five points, and five points after a tied race for much of the duration. My prediction below (spoiler alert!) that Obama will win the Granite State can also only help her. Here's what I expect the gubernatorial map to look like at the end of election night:

In the Senate, I also have a useful chart explaining which parties I expect to win which races, and how safe that prediction is. Obviously, I won't be picking against myself in any of those races that I've categorized (otherwise I'd just change the chart). But the chart does leave five races as tossups, and, yet again, I will make some random predictions for you.
My crystal ball will again be generous to Democrats, as I perceive the median voter's mood to be ever-so-slightly left-leaning at the moment, so I give them the top four tossups in the chart. In Massachusetts, I've thought that Democrat Elizabeth Warren would prevail from day one; Republican Senator Scott Brown eked out a win in 2010 only because turnout was so low and Republicans were so motivated to vote in that special election. The 2012 voter-turnout model, of course, will look very different in this deep-blue state. Still, Brown has proven to be probably the strongest Senate candidate in the entire country, keeping the race tight all year. It has only been recently that Warren has pulled ahead—slightly—in polling.
Virginia and Wisconsin both figure to feature razor-thin margins as well, and I'm not convinced that either candidate has an advantage as we stand today. On Election Day, though, it'll come down to turnout, and I expect Democrats to have the superior ground game in both states on Tuesday. This is in large part because both states are important swing states in the presidential, and (spoiler alert!) I view Obama as the favorite in both. That should be enough to pull Tim Kaine and Tammy Baldwin into the Senate.
A very interesting case is Indiana, which, along with Missouri, looks as though it could be one of two states where the Tea Party costs Republicans a Senate victory—2010 redux. This went from a safe Republican seat when it was Richard Lugar's to lose, to a lean Republican seat when the very conservative Richard Mourdock became the nominee, to a complete tossup (some would say leans Democrat!) when Mourdock made his controversial comments about rape. For me, that last straw threw the race into total confusion, and this may be the hardest Senate race to forecast because of it. Indiana remains a very Republican state on the presidential and gubernatorial level, yet the only public poll conducted after the rape comments showed a huge lead for Democrat Joe Donnelly. While I'm not sure I believe in such a huge margin, the momentum of the race is clearly away from the Republican—so I think this one will go blue too.
The one tossup where I ultimately expect the Republican to triumph is Montana. Democrat Jon Tester actually leads in the polling average at the moment, but this is one case in which I could easily foresee an upset, à la Nevada or Colorado in 2010. Montana is obviously a Republican-leaning state, and its support for Romney will present a hurdle for Tester; it's always harder to convince people to split their tickets than to vote the straight party line. This is, of course, the same reason why I chose Rick Hill to win the gubernatorial race in Big Sky Country. Indeed, my predictions are banking on Montana rediscovering its conservative roots.
Speaking of upsets—remember that, unlike the over-polled presidential race that I'll get to below, the smaller number of polls in many Senate races means there are fewer data available to make prognostications. This increases the margin of error and can make surprises more likely. That's a big part of the reason why there is usually an upset or two in the Senate races (and always a handful of upsets in the House). While I've picked them to go a certain way, this year I could see surprises taking place in Missouri, Arizona, and Nevada.
Missouri is an increasingly red state with an increasingly obtuse Republican candidate. Polls have shown Democratic Senator Claire McCaskill with a large lead because of it, but I've wondered for a while now if there may be latent support for Republican Todd Akin. No one wants to tell a pollster they're voting for an ostensibly sexist candidate, but when they get in the voting booth all by themselves, perhaps they'll fill out that secret ballot differently. This possibility is enhanced by the fact that most undecided Senate voters in Missouri are die-hard Republicans. In fact, according to Public Policy Polling, if Akin can pick up just 10% more Republican support, he wins. The libertarian candidate is also winning 6% of voters in the latest PPP poll, most of them Republicans. Will they come home? I do think it'll be close.
In Arizona and Nevada, the case is less complicated, and it all comes down to turnout among the Hispanic population. Democrat Richard Carmona is seeking to become the first Latino senator from Arizona, a state with a 30% Latino population but where Latinos made up only 13% of the vote in 2010. And, in Nevada, with an Obama win (spoiler alert!) looking likely, could the president's winning coalition pull Shelley Berkley over the finish line? Democrats in both states will be working hard to turn out these difference-making Hispanic voters.
In the end, though, I've still chosen to keep those three states in their "leans" categories. Totaling everything up, I project a 2013–14 Senate that consists of 53 Democrats (including two independents) and 47 Republicans—the exact same arrangement as today. Here's what it will look like:
That takes us to the big kahuna. My view of the state of the presidential race should actually be pretty uncontroversial, at least to anyone who follows the polls and accepts their consensus. It feels as though we've settled on a nonet of swing states whose combined 110 electoral votes will decide the next president; furthermore, with the rich supply of polling we've had there, it is fairly easy to put them on a spectrum from blue to red (numbers are as of Sunday afternoon):

I do not consider any state apart from these nine to be worth investigating in the presidential contest. In the week before Election Day, we've seen political observers go even more cuckoo than usual over states like Pennsylvania, Minnesota, and Arizona. Despite last-minute candidate visits and polls showing a close race, I find it incredibly unlikely that any of these states will deviate from conventional wisdom. Historically, states that have been in one candidate's column all cycle long do not just suddenly defect to the other on election night. If Romney wins Pennsylvania, Michigan, or Minnesota, or if Obama wins Arizona, it will be because the national race on the whole shifted significantly toward him at the last minute; consequently, this entire prediction will be rubbish, since that will have meant one of the candidates won in a landslide. In the end, no state other than the nine in the chart above will be decisive in the Electoral College, because no other states will be swing states in an election consistent with how closely contested this one has been.
To walk through those nine states—it would appear that the ones on the extremes would be the easiest to predict, and I agree with this school of thought. I expect North Carolina to go to Romney without much difficulty; beyond the public polling average, the president has not visited the state since the Democratic convention two months ago, suggesting that his campaign does not see it as truly competitive.
In Nevada, early voting shows a huge advantage for Democrats, leading the state's most prominent political analyst to expect an Obama win. Mark Mellman, Harry Reid's pollster who was one of the few who accurately forecast that Reid would hold on in 2010, also has Obama up. Then there are just the demographics: as long as the state's growing Hispanic population prefers Democrats, Nevada as a blue-leaning state may be the new normal.
Finally, Wisconsin is a state where the Romney/Ryan ticket has invested a lot of time and energy, keeping it within their reach. However, past election results show that Wisconsin just isn't anything but a blue state, and even a native vice-presidential candidate can't change that. There hasn't been a poll showing Romney leading in Wisconsin since August 19 (before the Denver debate and his greatest moment of the campaign), and the odds of a candidate winning a state despite so many data points to the contrary are astronomical. This same logic can be applied to North Carolina and Nevada; hence, I feel pretty confident about my predictions in this first triad of swing states.
Skipping Ohio for a moment, the next-closest states are our old friends Iowa and New Hampshire. These states have both sported the occasional polls showing Romney with a lead, though Obama still holds the upper hand on average. They also lack the solid additional circumstantial evidence of an edge one way or another that Nevada, Wisconsin, and North Carolina can boast. Given their historical proclivity for being very elastic, fickle states, I could certainly see them going for Romney, but I still have to side with the averages and say they'll fall in the blue column, where the polls have them pretty comfortably resting for the time being.
Totaling my predictions so far from above, we stand at 263 electoral votes for Obama and 206 for Romney with four states left to examine—any one of which would put Obama over the top. It's the same argument you've been hearing for a while now, so I apologize for repeating it, but it's true: Obama is the favorite in this election because he simply has more paths to 270 electoral votes. This election is like a best-of-seven playoff series where the incumbent leads three games to none. Historically, it's a commanding lead, with the blue team needing to win only one of their next four games. But as Mitt Romney's favorite team, the Boston Red Sox (who did it while he was their governor), have shown, it's possible to win four in a row.
But I'm trying to give you my for-entertainment-purposes-only pick, not a synopsis of the odds. Indeed, this is where this presidential forecast verges from grounded in fact and reason to based on the flip of a coin. In contrast to the states above, which I expect to be very close but resolved on election night, the next three are the ones where I don't think we'll know the winner until sometime during the day on November 7. (Keep a particular eye on Colorado, where Secretary of State Scott Gessler's controversial tactics and malfunctioning voting machines have made the state ripe for a legal battle.) In other words, these are the pure tossup states, the ones that will be decided by the decimal place.
My (arbitrary) pick in Colorado and Virginia is President Obama. Call it a hunch—and you'd be right—but I see a number of intangibles in his favor. Most importantly, there is Democrats' superior get-out-the-vote effort; Obama has more than twice as many field offices in Virginia as Romney does, and in Colorado "one top GOP consultant who has worked on presidential campaigns told [the Atlantic] he mentally added 2 to 4 points to Obama's polls in the state based on superior organization." Strong field teams not only are better at turning out a candidate's likely voters, but they're also more wont to tap into the "unlikely" voter pool—which polls of "likely voters" often miss. Registered voters who can't reliably be expected to make it to the polls usually skew Democratic and can include younger as well as non-white voters. Specifically, as with the Senate races in Nevada and Arizona, I believe Hispanic voter turnout could be a difference-maker in Colorado. You can bet that OFA will be trying to get every last vote out of the state's Latino community, which polls can often undersample and therefore underrate the impact of. Finally, one last group that many polls miss entirely are "cell-phone-only" voters—that is, voters, likely or not, who do not own a landline phone. Because many polling companies do not call cell phones, their results may underestimate this blue-leaning demographic.
These are all acceptable justifications for picking Obama when all other factors seem equal. But there are also similar arguments that favor Romney—perhaps the most convincing of which is to point at the national polling numbers. Unlike the state polls, where Obama has had an advantage, national polls have been consistently better for Romney, showing either a tied race or the Republican leading. (For the record, I do not foresee a popular vote/Electoral College split. That's not something a responsible predictor can ever "call," in my mind, because it has been so rare historically and the election would have to be uniquely close.) You can average the national polls with the aggregate of state polls to tell a more conservative-friendly tale than the state polls alone show. This is as good a reason as any to break my mental tie in the state of Florida in favor of Mitt Romney. Another is the advantage he seems to have in the swingiest region of this swingiest state: the I-4 corridor between Orlando and Tampa. With its high percentage of conservative Cuban-Americans, Florida is also a state where high Hispanic turnout would not necessarily aid Obama.
Finally, we return to Ohio—and, unfortunately for the GOP, this is the real stake in Romney's heart. Even if Romney wins all three coin flips above, he'll still need Ohio for the presidency, like every Republican before him—but as we saw from the chart above, Ohio is somewhere between Iowa and Nevada in terms of how safe it is for Obama. This is a state where liberals have been reenergized thanks to a concerted union effort to kill a ban on collective bargaining, where liberal senator Sherrod Brown is poised to cruise to reelection, and where you can bet Obama's ground-game advantage will manifest itself as much as anywhere (if you're an OFA volunteer from a non–swing state, you're going to Ohio.) And then there's the stubborn polling advantage that has implied that Obama's support is as solid as a rock. As Nate Silver wrote of Ohio, "There are no precedents in the database for a candidate losing with a two- or three-point lead in a state when the polling volume was that rich."
Because of Ohio, and also simply because of Romney's dire reliance on my three coin-flip states versus their expendability to Obama, I am confident that Obama will win a second term. I am much less confident about my specific prediction that he will win 303 electoral votes to Romney's 235, but there you have my map anyway:

Now let's see what happens.
(In seriousness, I do want to make it clear that this is in no way a scientific prediction. But I also don't think there's anything wrong with that, as long as it's acknowledged up front and everything that follows is kept in its proper perspective. Making predictions, as pundits do on Baseball Tonight or the World Series pregame show or whatever, is fun, and it's nothing I would begrudge anyone. I just wish punditry would be seen for what it is—entertainment.)
House
Here, my prediction will be the roughest and, probably, the most uninformed. Unfortunately, I haven't had a chance this cycle to look at the competitive House races in much depth. In 2006, 2008, and 2010, we had the benefit of knowing it was a "wave election," but there is no such trend this year. The consensus among experts is that there may be a slight Democratic edge (as in the Senate and presidential races), but it's close to a draw. If the parties split the tossup seats, Democrats would net only a handful—zero to five seems to be the generally agreed-upon range. Looking at the roster of competitive races, though, I find a bit more to like for Democrats. Going through this list, keeping score based on my sense of each race, and then splitting my own personal "tossups" 50-50, I make a back-of-the-napkin guess that the next House will consist of 202 Democrats and 233 Republicans.
Gubernatorial
In the underrated governors' races, I have already provided my overall rankings in the form of a spectrum accessible via the tab on the top of the page. This year, there are four clear Democratic favorites and four clear Republican favorites; you can see my picks for those on the Gubernatorial Rankings page. But what of the three tossups: Washington, New Hampshire, and Montana?
Well, the way the chart works is that I order the races from most Democratic to most Republican, so the tossup closest to the blue side is the one most likely to go blue and vice versa. However, I should emphasize that the reason I ever place any race in the "tossup" category is that it truly is too close to call—by definition, that there's nothing that gives me a hint the race is leading one way or the other. I'll pick them for you here—again, for entertainment purposes only—but know that it's a stab in the dark.
I'm going to say that Montana's next governor will be Republican Rick Hill, while Washington and New Hampshire will elect Democrats. In Montana, I expect that presidential coattails (i.e., the fact that Mitt Romney will win the state handily) will outweigh the coattails of an outgoing Democratic governor who's not on the ballot. In Washington, likewise, Barack Obama's easy win should help drive Jay Inslee–inclined supporters to the voting booth. Furthermore, Inslee has enjoyed a slight polling lead for a few months now, with the race only just recently drifting into the margin of error. In New Hampshire, the opposite has occurred, with Democrat Maggie Hassan coming off a strong set of polls showing her up four points, five points, and five points after a tied race for much of the duration. My prediction below (spoiler alert!) that Obama will win the Granite State can also only help her. Here's what I expect the gubernatorial map to look like at the end of election night:
Senate
In the Senate, I also have a useful chart explaining which parties I expect to win which races, and how safe that prediction is. Obviously, I won't be picking against myself in any of those races that I've categorized (otherwise I'd just change the chart). But the chart does leave five races as tossups, and, yet again, I will make some random predictions for you.
My crystal ball will again be generous to Democrats, as I perceive the median voter's mood to be ever-so-slightly left-leaning at the moment, so I give them the top four tossups in the chart. In Massachusetts, I've thought that Democrat Elizabeth Warren would prevail from day one; Republican Senator Scott Brown eked out a win in 2010 only because turnout was so low and Republicans were so motivated to vote in that special election. The 2012 voter-turnout model, of course, will look very different in this deep-blue state. Still, Brown has proven to be probably the strongest Senate candidate in the entire country, keeping the race tight all year. It has only been recently that Warren has pulled ahead—slightly—in polling.
Virginia and Wisconsin both figure to feature razor-thin margins as well, and I'm not convinced that either candidate has an advantage as we stand today. On Election Day, though, it'll come down to turnout, and I expect Democrats to have the superior ground game in both states on Tuesday. This is in large part because both states are important swing states in the presidential, and (spoiler alert!) I view Obama as the favorite in both. That should be enough to pull Tim Kaine and Tammy Baldwin into the Senate.
A very interesting case is Indiana, which, along with Missouri, looks as though it could be one of two states where the Tea Party costs Republicans a Senate victory—2010 redux. This went from a safe Republican seat when it was Richard Lugar's to lose, to a lean Republican seat when the very conservative Richard Mourdock became the nominee, to a complete tossup (some would say leans Democrat!) when Mourdock made his controversial comments about rape. For me, that last straw threw the race into total confusion, and this may be the hardest Senate race to forecast because of it. Indiana remains a very Republican state on the presidential and gubernatorial level, yet the only public poll conducted after the rape comments showed a huge lead for Democrat Joe Donnelly. While I'm not sure I believe in such a huge margin, the momentum of the race is clearly away from the Republican—so I think this one will go blue too.
The one tossup where I ultimately expect the Republican to triumph is Montana. Democrat Jon Tester actually leads in the polling average at the moment, but this is one case in which I could easily foresee an upset, à la Nevada or Colorado in 2010. Montana is obviously a Republican-leaning state, and its support for Romney will present a hurdle for Tester; it's always harder to convince people to split their tickets than to vote the straight party line. This is, of course, the same reason why I chose Rick Hill to win the gubernatorial race in Big Sky Country. Indeed, my predictions are banking on Montana rediscovering its conservative roots.
Speaking of upsets—remember that, unlike the over-polled presidential race that I'll get to below, the smaller number of polls in many Senate races means there are fewer data available to make prognostications. This increases the margin of error and can make surprises more likely. That's a big part of the reason why there is usually an upset or two in the Senate races (and always a handful of upsets in the House). While I've picked them to go a certain way, this year I could see surprises taking place in Missouri, Arizona, and Nevada.
Missouri is an increasingly red state with an increasingly obtuse Republican candidate. Polls have shown Democratic Senator Claire McCaskill with a large lead because of it, but I've wondered for a while now if there may be latent support for Republican Todd Akin. No one wants to tell a pollster they're voting for an ostensibly sexist candidate, but when they get in the voting booth all by themselves, perhaps they'll fill out that secret ballot differently. This possibility is enhanced by the fact that most undecided Senate voters in Missouri are die-hard Republicans. In fact, according to Public Policy Polling, if Akin can pick up just 10% more Republican support, he wins. The libertarian candidate is also winning 6% of voters in the latest PPP poll, most of them Republicans. Will they come home? I do think it'll be close.
In Arizona and Nevada, the case is less complicated, and it all comes down to turnout among the Hispanic population. Democrat Richard Carmona is seeking to become the first Latino senator from Arizona, a state with a 30% Latino population but where Latinos made up only 13% of the vote in 2010. And, in Nevada, with an Obama win (spoiler alert!) looking likely, could the president's winning coalition pull Shelley Berkley over the finish line? Democrats in both states will be working hard to turn out these difference-making Hispanic voters.
In the end, though, I've still chosen to keep those three states in their "leans" categories. Totaling everything up, I project a 2013–14 Senate that consists of 53 Democrats (including two independents) and 47 Republicans—the exact same arrangement as today. Here's what it will look like:
Presidential
That takes us to the big kahuna. My view of the state of the presidential race should actually be pretty uncontroversial, at least to anyone who follows the polls and accepts their consensus. It feels as though we've settled on a nonet of swing states whose combined 110 electoral votes will decide the next president; furthermore, with the rich supply of polling we've had there, it is fairly easy to put them on a spectrum from blue to red (numbers are as of Sunday afternoon):
I do not consider any state apart from these nine to be worth investigating in the presidential contest. In the week before Election Day, we've seen political observers go even more cuckoo than usual over states like Pennsylvania, Minnesota, and Arizona. Despite last-minute candidate visits and polls showing a close race, I find it incredibly unlikely that any of these states will deviate from conventional wisdom. Historically, states that have been in one candidate's column all cycle long do not just suddenly defect to the other on election night. If Romney wins Pennsylvania, Michigan, or Minnesota, or if Obama wins Arizona, it will be because the national race on the whole shifted significantly toward him at the last minute; consequently, this entire prediction will be rubbish, since that will have meant one of the candidates won in a landslide. In the end, no state other than the nine in the chart above will be decisive in the Electoral College, because no other states will be swing states in an election consistent with how closely contested this one has been.
To walk through those nine states—it would appear that the ones on the extremes would be the easiest to predict, and I agree with this school of thought. I expect North Carolina to go to Romney without much difficulty; beyond the public polling average, the president has not visited the state since the Democratic convention two months ago, suggesting that his campaign does not see it as truly competitive.
In Nevada, early voting shows a huge advantage for Democrats, leading the state's most prominent political analyst to expect an Obama win. Mark Mellman, Harry Reid's pollster who was one of the few who accurately forecast that Reid would hold on in 2010, also has Obama up. Then there are just the demographics: as long as the state's growing Hispanic population prefers Democrats, Nevada as a blue-leaning state may be the new normal.
Finally, Wisconsin is a state where the Romney/Ryan ticket has invested a lot of time and energy, keeping it within their reach. However, past election results show that Wisconsin just isn't anything but a blue state, and even a native vice-presidential candidate can't change that. There hasn't been a poll showing Romney leading in Wisconsin since August 19 (before the Denver debate and his greatest moment of the campaign), and the odds of a candidate winning a state despite so many data points to the contrary are astronomical. This same logic can be applied to North Carolina and Nevada; hence, I feel pretty confident about my predictions in this first triad of swing states.
Skipping Ohio for a moment, the next-closest states are our old friends Iowa and New Hampshire. These states have both sported the occasional polls showing Romney with a lead, though Obama still holds the upper hand on average. They also lack the solid additional circumstantial evidence of an edge one way or another that Nevada, Wisconsin, and North Carolina can boast. Given their historical proclivity for being very elastic, fickle states, I could certainly see them going for Romney, but I still have to side with the averages and say they'll fall in the blue column, where the polls have them pretty comfortably resting for the time being.
Totaling my predictions so far from above, we stand at 263 electoral votes for Obama and 206 for Romney with four states left to examine—any one of which would put Obama over the top. It's the same argument you've been hearing for a while now, so I apologize for repeating it, but it's true: Obama is the favorite in this election because he simply has more paths to 270 electoral votes. This election is like a best-of-seven playoff series where the incumbent leads three games to none. Historically, it's a commanding lead, with the blue team needing to win only one of their next four games. But as Mitt Romney's favorite team, the Boston Red Sox (who did it while he was their governor), have shown, it's possible to win four in a row.
But I'm trying to give you my for-entertainment-purposes-only pick, not a synopsis of the odds. Indeed, this is where this presidential forecast verges from grounded in fact and reason to based on the flip of a coin. In contrast to the states above, which I expect to be very close but resolved on election night, the next three are the ones where I don't think we'll know the winner until sometime during the day on November 7. (Keep a particular eye on Colorado, where Secretary of State Scott Gessler's controversial tactics and malfunctioning voting machines have made the state ripe for a legal battle.) In other words, these are the pure tossup states, the ones that will be decided by the decimal place.
My (arbitrary) pick in Colorado and Virginia is President Obama. Call it a hunch—and you'd be right—but I see a number of intangibles in his favor. Most importantly, there is Democrats' superior get-out-the-vote effort; Obama has more than twice as many field offices in Virginia as Romney does, and in Colorado "one top GOP consultant who has worked on presidential campaigns told [the Atlantic] he mentally added 2 to 4 points to Obama's polls in the state based on superior organization." Strong field teams not only are better at turning out a candidate's likely voters, but they're also more wont to tap into the "unlikely" voter pool—which polls of "likely voters" often miss. Registered voters who can't reliably be expected to make it to the polls usually skew Democratic and can include younger as well as non-white voters. Specifically, as with the Senate races in Nevada and Arizona, I believe Hispanic voter turnout could be a difference-maker in Colorado. You can bet that OFA will be trying to get every last vote out of the state's Latino community, which polls can often undersample and therefore underrate the impact of. Finally, one last group that many polls miss entirely are "cell-phone-only" voters—that is, voters, likely or not, who do not own a landline phone. Because many polling companies do not call cell phones, their results may underestimate this blue-leaning demographic.
These are all acceptable justifications for picking Obama when all other factors seem equal. But there are also similar arguments that favor Romney—perhaps the most convincing of which is to point at the national polling numbers. Unlike the state polls, where Obama has had an advantage, national polls have been consistently better for Romney, showing either a tied race or the Republican leading. (For the record, I do not foresee a popular vote/Electoral College split. That's not something a responsible predictor can ever "call," in my mind, because it has been so rare historically and the election would have to be uniquely close.) You can average the national polls with the aggregate of state polls to tell a more conservative-friendly tale than the state polls alone show. This is as good a reason as any to break my mental tie in the state of Florida in favor of Mitt Romney. Another is the advantage he seems to have in the swingiest region of this swingiest state: the I-4 corridor between Orlando and Tampa. With its high percentage of conservative Cuban-Americans, Florida is also a state where high Hispanic turnout would not necessarily aid Obama.
Finally, we return to Ohio—and, unfortunately for the GOP, this is the real stake in Romney's heart. Even if Romney wins all three coin flips above, he'll still need Ohio for the presidency, like every Republican before him—but as we saw from the chart above, Ohio is somewhere between Iowa and Nevada in terms of how safe it is for Obama. This is a state where liberals have been reenergized thanks to a concerted union effort to kill a ban on collective bargaining, where liberal senator Sherrod Brown is poised to cruise to reelection, and where you can bet Obama's ground-game advantage will manifest itself as much as anywhere (if you're an OFA volunteer from a non–swing state, you're going to Ohio.) And then there's the stubborn polling advantage that has implied that Obama's support is as solid as a rock. As Nate Silver wrote of Ohio, "There are no precedents in the database for a candidate losing with a two- or three-point lead in a state when the polling volume was that rich."
Because of Ohio, and also simply because of Romney's dire reliance on my three coin-flip states versus their expendability to Obama, I am confident that Obama will win a second term. I am much less confident about my specific prediction that he will win 303 electoral votes to Romney's 235, but there you have my map anyway:
Now let's see what happens.
Monday, October 29, 2012
In Defense of Nate Silver
It's Nate Silver's job to analyze the news—so it must have come as quite a shock to him today to find himself become the news. While criticism of Silver has been out there for a long time, its most recent form has cut straight at the heart of Silver's analysis and represents the same type of anti-intellectual fear that has followed trailblazers like him around for centuries. In a surprisingly acidic POLITICO article, Dylan Byers makes Joe Scarborough's case against Silver and his data-driven polling analyses:
But Byers, in the passage quoted above, clearly misses that point. Nowhere does it say that those 74.6%-to-25.4% figures are a prediction that Obama will win or that Romney will lose. It is an attempt to take a snapshot of the data and figure out odds. As Silver told Byers in the POLITICO article, there is still a significant chance that Romney wins—indeed, specifically, a one-in-four chance. If Romney wins, the model was not necessarily wrong. Indeed, every fourth time the model was run (Silver runs 10,001 simulations per day), Romney did win—and it's not a contradiction to say so while still handicapping Obama as the favorite.
Scarborough and, apparently, Byers seem to have a problem with this, but they don't seem to understand that this is the scientifically responsible way of doing this sort of thing. There is an academic discipline known as statistics, and they've been doing this a whole lot longer than any of us. Silver and others trained in this fickle art adhere to time-tested tactics such as the scientific method, gathering as-large-as-possible sample sizes, and acknowledging and even embracing the possibility of error.
In a world of post-debate insta-polls and Senate race rankings that are either Lean Democrat or Lean Republican, we as a society place a huge emphasis on "calling" states, elections, World Series, you name it. Audiences want instant gratification, and pundits give it to them with iron-clad predictions that they finalize and stick to come hell or high water.
What makes Nate Silver so unique—and so valuable—is that he resists that entirely (and yet still manages to be popular; imagine that!), favoring instead a scientifically responsible spectrum. The core tenet of this method lies in the difference between a 49% chance of an Obama win and a 51% chance of an Obama win. For most pundits, those are opposite predictions. On a spectrum, they're virtually identical. Given that it only takes a two-percentage-point swing to make up that difference, that's the right way to think about it.
Likewise, a spectrum always leaves room for some doubt. Even very safe predictions have a small chance of not happening, and a probability spectrum is honest about that fact, setting 99% or 99.9% odds for a very likely event. In other words, a good scientist always leaves room for the possibility that anything from extreme X to extreme Y will occur; the trick of creating a utile spectrum is knowing where to fix the "tipping point" between "lean X" and "lean Y," not picking one or the other. The beauty of a good probability spectrum is that it allows for every possibility. That's because the chance always exists, however small, that something extremely unlikely (e.g., a Romney landslide) will happen. In that sense, spectra like Silver's model will always be accurate.
And maybe that's the problem; skeptics see Silver's model's tolerant spectrum as wishy-washy—an attempt to take credit for being accurate no matter what the outcome. Science has one word for these people: "Tough." We have no choice but to accept this little ambiguity in our lives, because we have no way of ever being certain about anything. I understand that that is unsettling for many people, but that's what being a scientist—or even just being intellectually curious—is all about.
It also doesn't help matters that the exact figures and contours of a probability spectrum are impossible to prove. No one can ever say for sure that, on October 29, Barack Obama had a 74.6% chance of winning the race, even if Romney does win in that landslide. All we will know is the binary outcome: did Obama win or not, and by how much. It takes a much broader body of work to "prove" (to the extent anything can be proved) that those odds were correct—a body of work that, sadly, we'll never have. (You'd need the 2012 election to duplicate itself in future elections exactly the same way through October 29 a few hundred times, then see who won in each of those cases. In laboratories, these types of experiments are possible. Not in political science, where this is only the 57th presidential election in American history.) The best Silver—or anyone mortal in the whole wide world—can do is make an educated guess based on the data we do have. You may criticize which data—which polls or which economic variables—get plugged into Silver's model; you may not ignore science or the discipline of statistics.
Yet people do. People rely on their "gut" more than on the data in many more fields than just politics, and Silver has been dealing with them his whole life. As an early employee of Baseball Prospectus, Silver invented the PECOTA system and was an early figure in baseball's sabermetrics. He and co-Moneyball-ers tried to bring a rational, data-driven approach to predicting baseball the same way he has done in politics—and met with the same uninformed ridicule.
Baseball is full of the same "anti-statheads" that have come out of the woodwork in politics recently. You know them as the people who think of pitchers' wins as still a valuable statistic. They're the ones that denigrate WAR by saying that a better measurement of skill is actually how many wins you generate above a replacement level. They believe in momentum in baseball, in "clutch" hitting, and in the idea of lineup protection just because their experiences have led them to.
(Note: I'm painting with an extremely broad brush. In fact, I would like to see more rigorous statistical study on each of those last three. And you can indeed have a reasonable argument with other baseball experts or fans about those things—as long as the argument is empirical and grounded in data and facts, not "general impressions.")
The anti-Silverites in politics we see today are the descendants of the meanest versions of that baseball old guard: the old-timey scout who believes stats and innovation have nothing to offer him; the longtime columnist who bullies and mocks statisticians as "eggheads" or "binder boys." These people are as closed-minded as Nate's probability spectrum strives to be open-minded. The best analysis, and the best predictions, will inevitably come from viewing all available data and considering them holistically. As HardballTalk head blogger Craig Calcaterra says, quite astutely I think, if you worked in any field other than baseball and stubbornly ignored new information and new technology in your job, you'd be fired. Any field other than baseball or politics, I guess.
Maybe it's my wishful thinking, but it seems to me that those people in baseball are, fortunately, becoming more and more marginalized. Unfortunately, though, that's what makes those critics in politics much more dangerous—they are actually "important" pundits who are taken seriously. Indeed, in baseball, people can be as ignorant as they like, but the only real damage they're doing is taking up column inches and maybe, just maybe, encouraging a stupid trade to go down. In the powerful field of politics, ignorance can have a real effect on policies or the next leaders of the United States. They're playing with fire.
That's all the more reason to make sure Silver's voice of reason isn't drowned out. Unfortunately, Nate has caught onto the fact that many people in politics are jerks, and it may hasten his "retirement" from the field of political forecasting. (This most recent incident can't have helped.) But with Nate gone, unlike in baseball, the statistics-ignorant crowd will have won out, and political observers and the viewing public will go on thinking that the tools of ignorance are an acceptable forecasting model for elections.
I happen to roughly agree with Nate's prediction on the outcome of the presidential race, but losing his crystal ball is not even close to the reason his departure would sting. Rather, it's the loss of the reasonable, data-driven approach that he represents and has brought to the fields of baseball, politics, and others. Silver stresses that prediction is an imperfect science that he's just trying to make sense of, not solve. He is a student of the science of prediction, not a prognosticator per se. As he likes to say, it's not about which predictions are right, but rather which are less wrong. Instead of trying to eliminate error like those pundits and their iron-clad predictions, he truly does embrace it and see its value in helping improve subsequent forecasts. He's enhancing the study of predictions and helping us understand how to make them better—a goal that's bigger than elections, in some cases even helping to save lives.
Anyone who has given Silver's New York Times blog a more than cursory read recognizes all this, because Nate goes to pains to point it out (undoubtedly stung by ignorant would-be statisticians before). This isn't weakness, or being "unmanly," as it was distastefully put this week. It's realism and nuance, two traits that are essential for level-headed people in any field—only when it comes to predictors, they're basic qualifications.
"So should Mitt Romney win on Nov. 6, it's difficult to see how people can continue to put faith in the predictions of someone who has never given that candidate anything higher than a 41 percent chance of winning (way back on June 2) and — one week from the election — gives him a one-in-four chance, even as the polls have him almost neck-and-neck with the incumbent."Critiques of this ilk betray an inability to even speak intelligently on the subject of statistics, let alone a leg to stand on when presenting a counterargument to the findings of Silver's trademark Electoral College–predicting model. As I write this, Silver and his model give Barack Obama a 74.6% chance of victory on November 6. That number is very prominently labeled on Silver's website as "chance of winning." There's not much ambiguity in that. It should be obvious to anyone looking at that figure that what that means it that, in the judgment of the model, Mitt Romney has a 25.4% chance of winning the presidency.
But Byers, in the passage quoted above, clearly misses that point. Nowhere does it say that those 74.6%-to-25.4% figures are a prediction that Obama will win or that Romney will lose. It is an attempt to take a snapshot of the data and figure out odds. As Silver told Byers in the POLITICO article, there is still a significant chance that Romney wins—indeed, specifically, a one-in-four chance. If Romney wins, the model was not necessarily wrong. Indeed, every fourth time the model was run (Silver runs 10,001 simulations per day), Romney did win—and it's not a contradiction to say so while still handicapping Obama as the favorite.
Scarborough and, apparently, Byers seem to have a problem with this, but they don't seem to understand that this is the scientifically responsible way of doing this sort of thing. There is an academic discipline known as statistics, and they've been doing this a whole lot longer than any of us. Silver and others trained in this fickle art adhere to time-tested tactics such as the scientific method, gathering as-large-as-possible sample sizes, and acknowledging and even embracing the possibility of error.
In a world of post-debate insta-polls and Senate race rankings that are either Lean Democrat or Lean Republican, we as a society place a huge emphasis on "calling" states, elections, World Series, you name it. Audiences want instant gratification, and pundits give it to them with iron-clad predictions that they finalize and stick to come hell or high water.
What makes Nate Silver so unique—and so valuable—is that he resists that entirely (and yet still manages to be popular; imagine that!), favoring instead a scientifically responsible spectrum. The core tenet of this method lies in the difference between a 49% chance of an Obama win and a 51% chance of an Obama win. For most pundits, those are opposite predictions. On a spectrum, they're virtually identical. Given that it only takes a two-percentage-point swing to make up that difference, that's the right way to think about it.
Likewise, a spectrum always leaves room for some doubt. Even very safe predictions have a small chance of not happening, and a probability spectrum is honest about that fact, setting 99% or 99.9% odds for a very likely event. In other words, a good scientist always leaves room for the possibility that anything from extreme X to extreme Y will occur; the trick of creating a utile spectrum is knowing where to fix the "tipping point" between "lean X" and "lean Y," not picking one or the other. The beauty of a good probability spectrum is that it allows for every possibility. That's because the chance always exists, however small, that something extremely unlikely (e.g., a Romney landslide) will happen. In that sense, spectra like Silver's model will always be accurate.
And maybe that's the problem; skeptics see Silver's model's tolerant spectrum as wishy-washy—an attempt to take credit for being accurate no matter what the outcome. Science has one word for these people: "Tough." We have no choice but to accept this little ambiguity in our lives, because we have no way of ever being certain about anything. I understand that that is unsettling for many people, but that's what being a scientist—or even just being intellectually curious—is all about.
It also doesn't help matters that the exact figures and contours of a probability spectrum are impossible to prove. No one can ever say for sure that, on October 29, Barack Obama had a 74.6% chance of winning the race, even if Romney does win in that landslide. All we will know is the binary outcome: did Obama win or not, and by how much. It takes a much broader body of work to "prove" (to the extent anything can be proved) that those odds were correct—a body of work that, sadly, we'll never have. (You'd need the 2012 election to duplicate itself in future elections exactly the same way through October 29 a few hundred times, then see who won in each of those cases. In laboratories, these types of experiments are possible. Not in political science, where this is only the 57th presidential election in American history.) The best Silver—or anyone mortal in the whole wide world—can do is make an educated guess based on the data we do have. You may criticize which data—which polls or which economic variables—get plugged into Silver's model; you may not ignore science or the discipline of statistics.
Yet people do. People rely on their "gut" more than on the data in many more fields than just politics, and Silver has been dealing with them his whole life. As an early employee of Baseball Prospectus, Silver invented the PECOTA system and was an early figure in baseball's sabermetrics. He and co-Moneyball-ers tried to bring a rational, data-driven approach to predicting baseball the same way he has done in politics—and met with the same uninformed ridicule.
Baseball is full of the same "anti-statheads" that have come out of the woodwork in politics recently. You know them as the people who think of pitchers' wins as still a valuable statistic. They're the ones that denigrate WAR by saying that a better measurement of skill is actually how many wins you generate above a replacement level. They believe in momentum in baseball, in "clutch" hitting, and in the idea of lineup protection just because their experiences have led them to.
(Note: I'm painting with an extremely broad brush. In fact, I would like to see more rigorous statistical study on each of those last three. And you can indeed have a reasonable argument with other baseball experts or fans about those things—as long as the argument is empirical and grounded in data and facts, not "general impressions.")
The anti-Silverites in politics we see today are the descendants of the meanest versions of that baseball old guard: the old-timey scout who believes stats and innovation have nothing to offer him; the longtime columnist who bullies and mocks statisticians as "eggheads" or "binder boys." These people are as closed-minded as Nate's probability spectrum strives to be open-minded. The best analysis, and the best predictions, will inevitably come from viewing all available data and considering them holistically. As HardballTalk head blogger Craig Calcaterra says, quite astutely I think, if you worked in any field other than baseball and stubbornly ignored new information and new technology in your job, you'd be fired. Any field other than baseball or politics, I guess.
Maybe it's my wishful thinking, but it seems to me that those people in baseball are, fortunately, becoming more and more marginalized. Unfortunately, though, that's what makes those critics in politics much more dangerous—they are actually "important" pundits who are taken seriously. Indeed, in baseball, people can be as ignorant as they like, but the only real damage they're doing is taking up column inches and maybe, just maybe, encouraging a stupid trade to go down. In the powerful field of politics, ignorance can have a real effect on policies or the next leaders of the United States. They're playing with fire.
That's all the more reason to make sure Silver's voice of reason isn't drowned out. Unfortunately, Nate has caught onto the fact that many people in politics are jerks, and it may hasten his "retirement" from the field of political forecasting. (This most recent incident can't have helped.) But with Nate gone, unlike in baseball, the statistics-ignorant crowd will have won out, and political observers and the viewing public will go on thinking that the tools of ignorance are an acceptable forecasting model for elections.
I happen to roughly agree with Nate's prediction on the outcome of the presidential race, but losing his crystal ball is not even close to the reason his departure would sting. Rather, it's the loss of the reasonable, data-driven approach that he represents and has brought to the fields of baseball, politics, and others. Silver stresses that prediction is an imperfect science that he's just trying to make sense of, not solve. He is a student of the science of prediction, not a prognosticator per se. As he likes to say, it's not about which predictions are right, but rather which are less wrong. Instead of trying to eliminate error like those pundits and their iron-clad predictions, he truly does embrace it and see its value in helping improve subsequent forecasts. He's enhancing the study of predictions and helping us understand how to make them better—a goal that's bigger than elections, in some cases even helping to save lives.
Anyone who has given Silver's New York Times blog a more than cursory read recognizes all this, because Nate goes to pains to point it out (undoubtedly stung by ignorant would-be statisticians before). This isn't weakness, or being "unmanly," as it was distastefully put this week. It's realism and nuance, two traits that are essential for level-headed people in any field—only when it comes to predictors, they're basic qualifications.
Subscribe to:
Posts (Atom)